


R.H.A. Proposals for a
Page 36
Page 37
Page 38
If you've noticed an error in this article please click here to report it so we can fix it.
National Rates Schedule
Interim Report of Rates and Charges Committee Reviewed; An Excellent Piece of Work : Sound in Principle; Costs Plus Profits Basis for Rates
IHAVE been reading and critically examining the Interim Report of the Rates and Charges Committee of the Road Haulage Association, which contains proposals for a national rates structure and classification. It is a stout effort.
Above all, I am delighted to learn that, at tong last, the idea of attempting to build up a rates schedule by collecting data about thousands of streams of traffic, at the same time endeavouring to co-relate these rates to railway schedules, has been abandoned.
The principle of assessing rates on the basis of costs plus profits appears now to have been accepted. That is undoubtedly as it should be it is the fundamentally correct method. It can be applied to road-transport operation, but appears to be impossible of application to rail rates. If that be true, and I think it is, then the impracticability of relating road rates to rail rateS becomes obvious, and the relegation of. all such attempts is essential if progress along sound practical lines is to be achieved.
I am assuming, in writing this review, that all members of R.H.A. are acquainted with this publication and can have access to a copy if desired. The following are the matters which must be borne in mind when reading the report, interpreting its clauses and • making comparisons of the rates quoted with others of which readers have personal experience. .
In the first place, the Committee responsible for its compilation was set up by a Conference of the Central Road Panel members and representatives of the Regional Road Panels of the Road and Rail Central Conference and its Regional Committees. Secondly, at the expressed desire of the Conference, road factors only were taken into account in formulating the suggested structure. The Express Carriers' Functional Group was invited to present its recommendations for "smalls" traffic and its findings are incorporated in this report.
Traffics Dealt With by the Committee Apparently, the main committee dealt with traffics other than "smalls." It dealt with the problem in two sections: (1) costings and rates; (2) classification.
The report deals mainly with costings and rates. There is a sample classification and a good indication of the lines which classification will follow.
The foregoing gives what I may call the " set-up."
It is emphasized, in paragraph three of the report, that whilst all the figures given in the appendices were correct at the time they were considered, subsequent fluctuations may involve adjustment. That does not matter. It is with the principles that the Committee was concerned, and it is in relation to principles that the report should be read.
Paragraphs four to seven deal with the principle of the application of a national schedule of rates and the need for enforcement. I am not concerned with that aspect of the subject in this article and so pass on to paragraph eight, which gives the following as the headings under which data and costs were collated:—(1) Vehicle Costings; (2) Terminals; (3) Speed Ratio; (4) Balance Loading; (5) Composite Loading; (6) Profit; (7) Goods in Transit Risks.
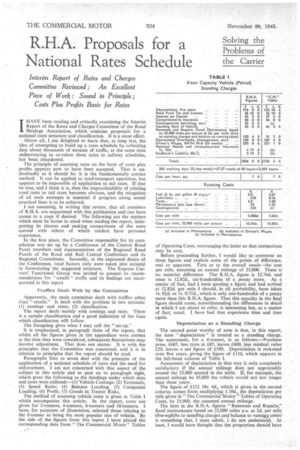
The method of assessing vehicle costs is given in Table 1 which accompanies this article. In the report, costs are given for 2-toniners, 4-tonners, 6-tonners and 10-tormers. I have, for purposes of illustration, selected those relating to the 6-tonner as being the most popular size of vehicle. By the side of the figures from this report I have placed the corresponding data from "The Commercial Motor" Tables of Operating Costs, rearranging the latter so that comparison may be easy.
Before proceeding farther, I would like to comment on these figures and explain some of the points of difference, real or apparent. First as to the overall result—the cost per mile, assuming an annual mileage of 25,000. There is no material difference. TheR.H.A. figure is 12.74d. and mine is 12.82d., six-hundredths of a penny more. As a matter of fact, had I been quoting a figure and had arrived at 12.82d. per mile I should, in all probability, have taken Is. 02d. or Is. 0.75d., which-is only one-hundredth of a penny more than this R.H.A. figure. That this equality in the final figure should come, notwithstanding the differences in detail te which I am about to refer, is interesting but, as a matter of fact, usual. I have had that experience time and time again.
Depreciation as a Standing Charge The second point worthy of note is that, in this report, the item " depreciation " is treated as a standing charge. The assessment, for a 6-tonner, is as follows:—Purchase price, £685, less tyres at £85, leaves £600, less residual value £20, leaves a net figure of £580. Depreciation is reckoned over five years, giving the figure of £116, which appears in the left-hand column of Table L Assessment of depreciation in that way is only completely satisfactory if the annual mileage does not appreciably exceed the 25,000 quoted in the table. If, for example,, the annual mileage be 45,000 the vehicle would not last longer than three years.
The figure of £122 18s. 4d., which is given in the second column, comes from multiplying 1.18d., the depreciation per mile given in "The Commercial-Motor " Tables of Operating Costs, by 25,000, the assumed annual mileage.
The item in the R.H.A. figures "Renewals and Repairs," fixed maintenance based on 25,000 miles p.a. at 2d. per mile (five-eighths to standing charges and balance to running costs) is something that, I must admit, i do not understand. At least, I would have thought that the proportion should have been reversed, so that iths of the total were treated as standing Charges and the rest as running costs. That is more in accord with my own experience. However, so long as the annual mileage does not greatly exceed 25,000, the matter is not of great. importance.
What does intrigue me is the total of maintenance costs as compared with my own. The R.H.A. total for expenditure per annum, including the provision for "contingencies," is £247 7s. Id., as compared with my total of £159 7s. 6d. -and I have often been told that my figures for maintenance are high!
Big Difference in Figures for Overheads
There is a rather substantial difference as regards overheads and, in this case, my figure is higher at £187 4s., as against £120. Notwithstanding these differences between individual items of the standing charges, the totals are fairly even, £806 for the report and £746 4s. 4d. for mine. Incidentally, there is an error in the assessment of the hourly cost. In the report it should be 7s. 7d. and not 7s. as stated. It must, of course, be an arithmetical error and not an approximation, because the 7d. means a difference of 8 per cent., and is a reduction of that amount out of the 10 per cent, profit, which is all that is allowed in the assessment of rates.
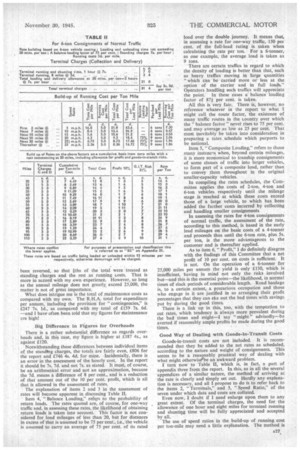
The explanation of items 2 and 3 in the assessment of rates will become apparent in discussing Table II.
Item 4, "Balance Loading," refe,rs to the probability of return loads. The rates quoted are, of course, for one-way traffic and, in assessing these rates, the likelihood of obtaining return loads is taken into account. This factor is not considered for load mileages of less than 20, but for distances in excess of that is assumed to be 75 per cent:, Le., the vehicle is assumed to carry an average of 75 per cent, of its rated load over the double journey. It means that, in assessing a rate for one-way traffic, 150 per
exceeding cent, of the full-load rating is taken when per hour ; calculating the rate per ton. For a fi-tonner,
as one example, the average load is taken as 9 tons.
There are certain traffics in regard to which the density of loading is better than that, such as heavy traffics moving in large quantities "which can be carried more or less at the option of the carrier and in full loads." Operators handling such traffics will appreciate the point. In these cases a balance loading factor of 87i per cent. is taken.
All this is very fair. There is, however, no reference whatever in the report to what I might call the route factor, the existence of many traffic routes in the country over which the balance factor" never rises to 75 per cent. and may average as low as 25 per cent. That must inevitably be taken into consideration in preparing a rates schedule which purports to be national.
Item 5, "Composite Loading," refers to those many instanw!s, when, beyond certain mileages, it is more economical to tranship consignments of some classes of traffic into larger vehicles, to form -part of a composite load, rather than to convey them throughout in the original smaller-capacity vehicles.
In compiling the rates schedules, the Committee applies the costs of 2-ton, 4-ton and 6-ton vehicles respectively until the mileage stage is reached at which these costs exceed those of a large vehicle, to which has been added the further costs incurred by collecting and handling smaller consignments In assessing the rates for 4-ton consignments of normal traffic, the assessment of the rate, according to this method, is based in the early lead mileages on the basic costs of a 4-tonner and proceeds thus until the 6-ton rate, plus 5s. per ton, is the more advantageous to the customer and is thereafter applied.
As to item 6. "Profit," I do definitely disagree with the findings of this Committee that a net profit of 10 per cent. on costs is sufficient. It is not. On the operation of a 6-tomer for 25,000 miles pet annum the yield is only £130, which is insufficient, having in mind not only the risks involved but-and this is the essential point-the likelihood, in normal times of slack periods of considerable length. Road haulage is, to a certain extent, a precarious occupation and those who engage in it are justified in so arranging their profit percentages that they can eke out the bad times with savings put by during the good times.
There is a link up in this, too, with the temptation to cut rates, which tendency is always more prevalent during the bad times and might-I say " might " advisedly-be averted if reasonably ample profits be made during the good times.
Good Way of Dealing with Goods-in-Transit Costs Goods-in-transit costs are not included. It is recommended that they be added to the net rates as scheduled, according to the nature and weight of consignments. This seems to be a reasonably practical way of dealing with what might otherwisbe an awkward problem. I turn now to Table II, which is, in fact, a part of appendix three from the report. In this, as in all the several appendices of a similar nature, the method of arriving at the rate is clearly and simply set out. Hardly any explanation is necessary, and all I propose to do is to refer back to the items 2, "Terminals," and 3, "Speed Ratio," of the seven under which data and costs are collated.
Even now, I doubt if I need enlarge upon them to any great extent. Of the terminal charges, the need for the allowance of one hour and eight miles for terminal running and shunting time will be fully appreciated and accepted by all. The use of speed ratios in the build-up of running cost per ton-mile may need a little explanation. The method is A27.
one I have used myself many a time. It assumes that, on starting away, most probably in a traffic-congested area, the vehicle will, for the first three miles, average 5 m.p.h. its cost per mile will be made up of the running cost of 5d. per mile (see left-hand column of Table I), plus the time cost per mile, which is one-fifth of 7s., i.e., 16.8d. The total cost per mile run is the sum of these two amounts, namely, 21.8d. The running cost per lead mile—which involves two miles of running—is 43.6d.; the load carried is 6 tons (no provision for balance loading at this distance), and the running cost per ton-mile is, thus, 7.30d.
For the next seven miles the going is easier, the speed is assumed to be 10 m.p.h., and the time cost per mile is accordingly halved, the running cost of 5d, per mile remaining as before, up to 20 miles, when provision is made for balance loading and the pay-load assumed to be 9 tons.
Many readers no doubt, looking at the lower part of the table, would like to know how the figures under the heading "cumulative per ton mile cost" are calculated. This is the way. First, there are three miles at 7.30d. per ton mile; which is 21.90d.; then seven miles at 4.47d., which is 31.29d.; then 10 miles at 3.53d., which is 35.30d. These total 88.49d., or 7s. 4.49d., the cumulative ton mile cost for 20 miles. For the next five miles the running cost per ton mile is 2.04d. per mile and five times that is 10.20d., which, added to 7s. 4.49d., gives the 8s. 2.69d. which I have shown in the table.
This cumulative per ton mile cost must be added to the terminal cost of 5s. 3d. to get the total cost per ton per mile. Then are added the profit, 0.1.1. risk of 2i per cent. giving the rate per ton. S.T.R.