


Reading the graph
Page 51
If you've noticed an error in this article please click here to report it so we can fix it.
QHOWN here are typical fuel consumption loops for a
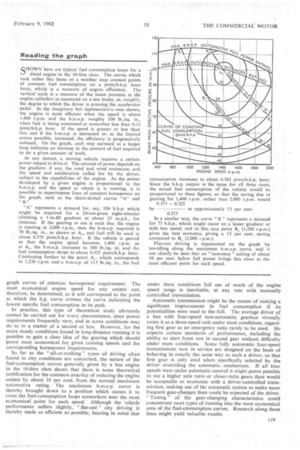
diesel engine in the 10-litre class. The curves which look rather like those on a weather map connect points of Constant fuel consumption on a pints/b.h.p. hour basis, which is a measure of engine efficiency. 'The vertical scale is a measure of the mean pressure in the engine cylinders as measured on a test brake, or, roughly, the degree to which the driver is pressing the accelerator pedal. In the imaginary but representative case shown, the engine is most efficient when the speed is about 1,400 r.p.m. and the b.m.e.p. roughly 100 lb./sq. in., when fuel is being consumed at somewhat less than 0.33 pints/b.h.p. hour. If the speed is greater or less than this and if the b.m.c.p. is decreased or, to the limited extent posSible, increased, the efficiency is progressively reduced. On the graph, each step outward to a larger loop indicates an increase in the amount of fuel required to do a given amount of work.
At any instant, a moving vehicle requires a certain power output to drive it. The amount of power depends on the gradient, if any, the road and wind resistance, and the speed and acceleration called for by the driver, subject to the capabilities of the engine. As the power developed by a given engine is proportional to the b.m.e.p. and the speed at which it is running, it is possible to superimpose lines of constant horsepower on the graph, such as the chain-dotted curves "A" and
"A" represents a demand for, say, 104 b.h.p. which might be required for a .24-ton-gross eight-wheeler climbing a 1-in-SO gradient at about 25 m.p.h., for instance. If the gearing in use is such that the engine is running at 2,000 r.p.m., then the b.m.e.p. required is 70 lb./sq. in., as shown at A, and fuel will be used at about 0.375 pints/b.h.p. hour. If the vehicle is geared so that the engine speed becomes 1,400 r.p.m. as at A,, the b.m.e.p. increases to 100 lb./sq. hi. and the fuel consumption drops to about 0.325 pints/b.h.p. hour. Continuing further to the point A,, which corresponds to 1,230 r.p.m. and a b.m.e.p. of 113 lb./sq. in., the fuel 600 800 1000 1200 1400 1600 ENGINE SPEED (r.p.m) consumption increases to about 0.342 pin ts/b.h.p. hour. Since the b.h.p. output is the same for all three cases, the actual fuel consumption of the vehicle would be proportional to these figures, so that the saving due to gearing for 1,400 r.p.m. rather than 2,000 r.p.m. would 0.375 — 0.325
be or approximately 13 per cent. 0.375
In a similar way, the curve "B" represents a demand for 73 b.h.p., which might occur on a lesser gradient or with less speed, and in this case point 82 (1,200 r.p.m.) gives the best economy, giving a 15 per cent, saving compared to 11 (2,000 r.p.m.).
Flat-out driving is represented on the graph by travelling along the maximum b.m.e.p. curve, and it can clearly be seen that an " economy " setting of about 10 per cent, below full power brings this close to the most efficient point for each speed. 1800 2000