


Fit 'NEI
Page 36
Page 37
If you've noticed an error in this article please click here to report it so we can fix it.
IN THE CAB
Tachograph evidence has helped drivers keep out of trouble, out of court and even out of jail. Two accident investigators show CM how charts can prove who was really at fault in a motorway pile-up.
• The "spy in the cab" was how drivers dubbed the tachograph when it was first introduced to the UK in the 1970s.
But Peter Needham, accident evaluation manager at Lucas Kienzle, the Birmingham-based tachograph manufacturer, reckons that these days drivers are just as likely to regard it as the "friend in the cab".
Needham and colleague Keith Lloyd, a former liome Office forensic analyst, spend most of their time analysing the tachograph charts of trucks, coaches and buses which have been involved in accidents.
Much of their work is carried out for insurance companies, which need detailed analyses to settle claims. Solicitors also use the service for defence in civil and criminal cases, as do employers when they are looking for evidence to help with industrial tribunal cases.
"Tachograph charts are now well accepted as objective evidence in courts," says Needham.
For accident analysis Needham and Lloyd work from original tacho charts, not photographs, and to help compile an accurate picture of events they also need details of the incident including the number and type of vehicles involved, road and weather conditions, location, load being carried and a summary of the driver's accident report.
MAGNIFICATION
Each tacho chart is examined, using 20 times magnification so that the last moments of a vehicle's progress before an accident can be scrutinised.
The chart can be broken down into onesecond intervals and read off by speed. "This interval is of crucial importance," says Lloyd. "You need to be able to read down to individual seconds to be able to pick out braking rates accurately."
Information is transferred from the microscope to a computer, fed with calibration data, which can produce graphs and diagrams showing acceleration and de celeration rates. This can determine whether a person was driving aggressively before an accident.
The analysis can also calculate how far away from the accident impact a vehicle was when it reached a certain speed. "This is very useful in trying to prove or disprove a charge of reckless driving," says Lloyd. "If we can show that a driver took bends at reasonable speed and travelled through villages and towns en route within the legal speed limit, the driver will be able to support his claim that he was not driving recklessly."
REFERENCE
To check the calibration of the tachograph, the analysts re-trace the vehicle back to certain reference points, checking the recording against a map of the area and working out the distance back from the accident to a key point, such as a junction.
"With most cases we take the last few minutes prior to an accident and build up a picture of the changes in speed," says Lloyd. The reading can be distorted by an accident, however, and only a trained eye can make a correct diagnosis of events.
When a vehicle overturns, for instance, the wheels spin and the tacho stylus will whip up and jump up and down, Needham explains. "If you look at the splodge the stylus makes at the top of the chart it will seem as if the vehicle was doing 80mph (130km/h) on a bend, whereas the true speed was actually below the speed limit."
The impact of a head-on collision can also distort the reading with lockedwheels showing a speed of Omph instead of the speed at the point of impact.
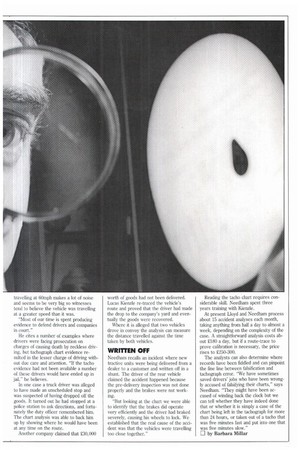
"In any accident there will be a jigsaw of circumstances that lead up to it," says Needham. "The tacho chart could be a large piece of that jigsaw or a very small piece, but all the pieces must join together."
The pieces that often do not fit are eyewitness accounts, especially where trucks and coaches are involved. "A truck
travelling at 60mph makes a lot of noise and seems to be very big so witnesses tend to believe the vehicle was travelling at a greater speed than it was.
"Most of our time is spent producing evidence to defend drivers and companies in court"
He cites a number of examples where drivers were facing prosecution on charges of causing death by reckless driving, but tachograph chart evidence resulted in the lesser charge of driving without due care and attention. "If the tacho evidence had not been available a number of these drivers would have ended up in jail'. he believes.
In one case a truck driver was alleged to have made an unscheduled stop and was suspected of having dropped off the goods. It turned out he had stopped at a police station to ask directions, and fortunately the duty officer remembered him. The chart analysis was able to back him up by showing where he would have been at any time on the route.
Another company claimed that 20,000 worth of goods had not been delivered. Lucas Kienzle re-traced the vehicle's route and proved that the driver had made the drop to the company's yard and eventually the goods were recovered.
Where it is alleged that two vehicles drove in convoy the analysis can measure the distance travelled against the time taken by both vehicles.
WRITTEN OFF
Needham recalls an incident where new tractive units were being delivered from a dealer to a customer and written off in a shunt. The driver of the rear vehicle claimed the accident happened because the pre-delivery inspection was not done properly and the brakes were not working.
"But looking at the chart we were able to identify that the brakes did operate very efficiently and the driver had braked severely, causing his wheels to lock. We established that the real cause of the accident was that the vehicles were travelling too close together," Reading the tacho chart requires considerable skill. Needham spent three years training with Kienzle.
At present Lloyd and Needham process about 15 accident analyses each month, taking anything from half a day to almost a week, depending on the complexity of the case. A straightforward analysis costs about .180 a day, but if a route-trace to prove calibration is necessary, the price rises to £250-300.
The analysts can also determine where records have been fiddled and can pinpoint the fine line between falsification and tachograph error. "We have sometimes saved drivers' jobs who have been wrongly accused of falsifying their charts," says Needham. "They might have been accused of winding back the clock but we can tell whether they have indeed done that or whether it is simply a case of the chart being left in the tachograph for more than 24 hours, or taken out of a tacho that was five minutes fast and put into one that was five minutes slow."
LI by Barbara Millar