


Ministry Analyses 1_00,000 Accidents
Page 34
Page 35
If you've noticed an error in this article please click here to report it so we can fix it.
Informative Deductions to be Made from Official Statistics Showing the Incidence and Causes of Road Acci. dents Over a Period of Six Months. Problems that Brook No Delay in Their Solution
THE results of the new investigations into road accidents, which have recently been circulated by the Ministry of Transport, provide useful evidence which has not, hitherto, been available on a problem of first magnitude to all road users. It analyses the reports of 100,000 aecidents, involving personal injury, -which occurred during the period from -April to September, 1936, and whilst, in some directions, the results are what one might reasonably expect, there are, nevertheless, some illuminating deductions to be made from a close study of the official figures. Information is given for the first time of the incidence and causes of road accidents, involving injuries to persons, which did not prove fatal, as well as of those in which fatal injuries were inflicted.
Among the salient facts which emerge from the analysis is the relative severity of accidents in areas not built-up, where speeds would normally be higher and where 38 per cent. of the accidents resulted in death or serious injury, contrasted with 23.3 per cent, in built-up areas.
Large Number of Accidents at Junctions.
It is also made clear that a high proportion of accidents -42.2 per cent, of those analysed-takes place at junctions, especially in built-up areas (47.4 per cent.). As one might suppose, most of the latter occurred at uncontrolled junctions, the total of 30,381 representing a percentage of 39.7; accidents at controlled junctions totalled 5,896, equivalent to 7.7 per cent. Similar details in respect of areas not built-up give 5,274 accidents at uncontrolled junctions and 617 at controlled junctions, giving percentage totals of 22.5 and 2.6 respectively. These accidents aggregate 42,168, the total being made up to 100,000 by the following: In all, 42 per cent, of the accidents occurred at junctions and 51 per cent. on straight roads Or open road bends with good sight lines. Those fanatics who raise their voices against present-day speeds in derestricted areas will obtain little solace from the fact that 761per cent, of the accidents took place in built-up areas.
In one-third of the cases analysed, a driver was held to be at fault, in 28 per cent, a pedestrian, and in 26 per cent.
a cyclist. In respect of fatal accidents, the figure for drivers varied little compared with 1935, but those for cyclists increased from 16.5 per cent. to 19.5 per cent., whilst those for pedestrians fell from 40.7 per cent. to 36.5 per cent.
In nearly 8,000 cases (over 28 per cent.) for which pedestrians were held responsible, the accident was ascribed to a child under seven years of age. Safety-first educative propaganda has done much to inculcate a road sense into the juvenile, mind, but it does seem that more intensive methods would minimize the risks run by children.
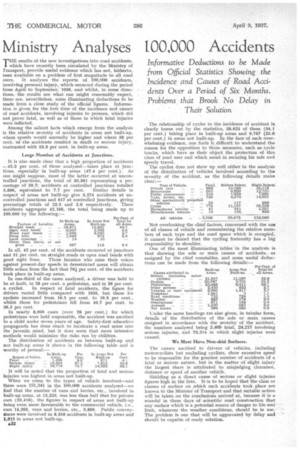
The distribution of accidents as between built-up and not built-up areas is shown in the following table and is worthy of perusal:
In Built-up Per In Areas Not Per
Extent of Iniury. Areas. Cent. Built-up Cent. Fatal . 1,498 2.0 071 4.1 Serious injury ... 16.304 21.5 7,913 33.8 Slight injury .. 58,779 76.7 14,535 62.1
It will be noted that the proportion of fatal and serious Injuries was highest in areas not built-up.
When we come to the types of vehicle involved-and there were 151,341 in the 109,000 accidents analysed-we find that the number of vans and lorries, etc., involved in built-up areas, at 15,223, was less than half that for private cars (33,418), the figures in respect of areas not built-up being even more favourable to the commercial vehicle, i.e., cars 14,265, vans and lorries, etc., 3,868. Public conveygnces were involved in 8,358 accidents in built-up areas and L013 in areas not built-up.
a32
The relationship of cycles to the incidence of accident is clearly borne out by the statistics, 38,624 of them (34.1 per cent.) taking place in built-up areas and 9,767 (25.a per cent.) in areas not built-up. In the face of such overwhelming' evidence, one finds it difficult to understand the reason for the opposition to those measures, such as Cycle tracks, which have as their object the protection of this class of road user and which assist in securing his safe and speedy travel.
The cyclist does not show up well either in the analysis of the distribution of vehicles involved according to the severity of the accident, as the following details make Not overlooking the chief factors, concerned with the use of all classes of vehicle and remembering the relative numbers of each type and the road space which is occupied, it cannot be denied that the cycling fraternity has a big responsibility to shoulder.
One of the most illuminating tables in the analysis is that showing the sole or main causes of accidents, • as assigned by the chief constables, and some useful deductions can he made from the following details:
Under the same headings are. also given, in tabular farm, details of the distribution of the sole or main causes aSsigned in accordance with the severity of the accident, the numbers analysed being 2,469 fatal, 24,217 involving serious injuries, and 73,314 in which slight injuries were caused.
We Must Have Non-skid Surfaces.
The causes ascribed to drivers of vehicles, including motorcyclists but excluding cyclists, show excessive speed to he responsible for the greatest number of accidents of a fatal or serious nature, but in the matter of slight injury the largest share is attributed to misjudging clearance, distance or speed of another vehicle.
Skidding as a direct cause of serious or slight injuries figures high in the lists. It is to be hoped that the class or classes of surface on which such accidents took place are known to the Minister of Transport and that suitable action will be taken on the conclusions arrived at, because it is a scandal in these days of scientific road construction that any surface which is a potential source of danger to life and limb, whatever the weather conditions, should be in use. The problem is one that will be aggravated by delay and should be capable of ready solution.
Road users have a right to demand that their free passage along the highway is fraught with the minimum risk, especially in view of the extent of their contributions, by way of direct and indirect taxation, to the Road Fund.
The Pedestrians' Association will find food for thought in the following figures, showing the causes ascribed to pedestrians:— The sole or chief cause of 33 fatal accidents and 2,359 non-fatal accidents was attributed to persons boarding or alighting from vehicles without due care.
The final table in the analysis shows the principal miscellaneous causes of accidents, the particulars relating The figures do not make pleasant reading, but if they do nothing else but rouse the official mind to a recognition of the gravity of one of the leading national problems of the day, the time spent in their meticulous compilation will not have been wasted. The solution of the problem is a responsibility to he shared by every section of the public and palliative measures must not be only the burden of the motorist if a lasting improvement in the accident returns is to be recorded. Certain phases of the problem, notably in connection with road planning, surfacing, etc„ can only be tackled by the Government. Let it act quickly if future statistics are to make a happier impression on the public mind and to restore confidence in our administrators.