Costs Up Profits Down
Page 51

If you've noticed an error in this article please click here to report it so we can fix it.
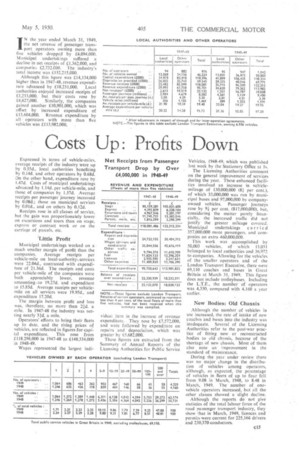
IN the year ended March 31, 1949, the net revenue of passenger transport operators owning more than five vehicles dropped by £4,094,000. Municipal undertakings suffered a decline in net receipts of £1,362,000, and companies 12.732.000. The industry's total income was 1132.215.000.
Although this figure was £14,134,000 higher than in 1947-48, revenue expendi
ture advanced by 118,231,000. Local .authorities enjoyed increased receipts of 13,213,000. but their costs rose by £4,627,000. Similarly, the companies gained another 110,901,000, which was offset by increased expenditure of £13,604,000. Revenue expenditure by all • operators with more than five vehicles.was 1113,982,000.
Expressed in terms of vehicle-miles, average receipts of the industry were up by 0.55d., local authorities benefiting by 0.144. and other operators by 0.68d. On the other hand, expenditure rose by 1.47d. Costs of municipal undertakings advanced by 1.144. per vehicle-mile, and those of companies by I.57d. Average receipts per passenger journey increased by 0.08d.; those on municipal services by 0.01d„ and on others by 0.12d.
Receipts rose in all classes of service, hut the gain was proportionately lower on excursions and tours than on stage. express or contract work or on the carriage of parcels, etc.
qAttle Profit Municipal undertakings worked on a much smaller margin of profit than the companies. Average receipts per vehicle-mile on local-authority% services were 22.04d., contrasted with expenditure of 21.36d. The receipts and costs per vehicle-mile of the companies were both appreciably lower, revenue amounting .to 19.27d, and expenditure to 15.85d. Average receipts per vehiclemile on all services were 19.95d.,' and expenditure 17.20d.
The margin between profit and loss was, therefore, no more than nd. a mile. M 1947-48 the industry was netting nearly 3d. a mile.
Operators! efforts to bring their fleets up to date, and the rising prices of vehicles, are reflected in figures for capital expenditure. This rose from £118.296,000 in 1947-48 to £148,334,000 in 1948-49.
Wages represented the largest indi
vidual item in the increase of revenue expenditure. They rose by £7,572,000, and were followed by expenditure on repairs and depreciation, which was greater by 15.682.000.
These figures are extracted from the Summary of Annual Reports of the Licensing Authorities for Public Service Vehicles, 1948-49, which was published last week by the Stationery Office at Is.
The Licensing Authorities comment on the general improvement of services during the year. These enhanced facilities involved an increase in vehiclemileage of 130,000,000 (81 per cent.), of which 33,000.000 was run by municipal buses and 97.000.000 by companyowned vehicles. Passenger journeys rose by 91 per cent, (817,000.000). but. considering the matter purely financially, the increased traffic did not justify the greater mileage covered. Municipal undertakings carried 357,000,000 more passengers, and companies an extra 460,000,000.
This work was accomplished by 50,003 vehicles, of which 13,011 belonged to local authorities and 36,972 to companies. AlloWing for the vehicles of the smaller operators and of the London Transport Executive, there were 69,110 coaches and buses in Great Britain at March 31, 1949. This figure does not include trolleybuses. including the L.T.E., the number of operators was 4.330, compared with 4.160 a year earlier.
New Bodies: Old Chassis
Although the number of vehicles in use increased, the rate of intake of new coaches and buses into the industry was inadequate. Several of the Licensing Authorities refer to the post-war practice of fitting new or reconstructed bodies to old chassis, because of the shortage of new chassis. Most of them also note an improvement in the standard of maintenance.
During the year under review there was no major change in the distribution of vehicles among operators, although, as expected, the percentage of vehicles in fleets of up to four felt from 9.08 in March, 1948, to 8.48 in March, 1949, The• number of onevehicle operators increased, but all the other classes showed a slight decline.
Although the reports do not give statistics of the total labour force of the road passenger transport industry, they show that in March, 1949, licences and permits-were current for 225,166 drivers and 230,370 conductors.


