 1
1 2
2 3
3 4
4 5
5 6
6 7
7 8
8 9
9 10
10 11
11 12
12 13
13 14
14 15
15 16
16 17
17 18
18 19
19 20
20 21
21 22
22 23
23 24
24 25
25 26
26 27
27 28
28 29
29 30
30 31
31 32
32 33
33 34
34 35
35 36
36 37
37 38
38 39
39 40
40 41
41 42
42 43
43 44
44 45
45 46
46 47
47 48
48 49
49 50
50 51
51 52
52 53
53 54
54 55
55 56
56 57
57 58
58 59
59 60
60 61
61 62
62 63
63 64
64 65
65 66
66 67
67 68
68 69
69 70
70 71
71 72
72 73
73 74
74 75
75 76
76 77
77 78
78 79
79 80
80 81
81 82
82 83
83 84
84 85
85 86
86 87
87 88
88 89
89 90
90 91
91 92
92 93
93 94
94 95
95 96
96 97
97 98
98 99
99 100
100 101
101 102
102 103
103 104
104 105
105 106
106 107
107 108
108 109
109 110
110 111
111 112
112 113
113 114
114 115
115 116
116 117
117 118
118 119
119 120
120 121
121 122
122 123
123 124
124 125
125 126
126 127
127 128
128 129
129 130
130 131
131 132
132 133
133 134
134 135
135 136
136 137
137 138
138 139
139 140
140 141
141 142
142 143
143 144
144 145
145 146
146 147
147 148
148 149
149 150
150 151
151 152
152 153
153 154
154 155
155 156
156 157
157 158
158 159
159 160
160 161
161 162
162 163
163 164
164 165
165 166
166 167
167 168
168 169
169 170
170 171
171 172
172 173
173 174
174 175
175 176
176 177
177 178
178 179
179 180
180 181
181 182
182 183
183 184
184 185
185 186
186 187
187 188
188 Statistics favour single-deck buses
Page 64
Page 65
Page 66
If you've noticed an error in this article please click here to report it so we can fix it.
ACCORDING to his latest information, the main types of bus operating in Britain were made up of four groups, Mr R. Bailey, general manager of Lancashire United Transport Ltd, told delegates to the annual conference of the PRTA on Thursday, (see page 37). Representing a total of 74,000 vehicles, the groups, and percentage of the total were as follows: 7,000 rear transverse-engined double-deck (9.5); 29,000 front-engined double-deck (39.2); 14,000 underfloor or rear-engined single-deck (18.9); and 24,000 coaches or semi-coaches (32.4).
In 1967 and 1968 the number of singledeck buses increased by nearly 1000 each year with a more than compensating reduction in the number of double-deckers.
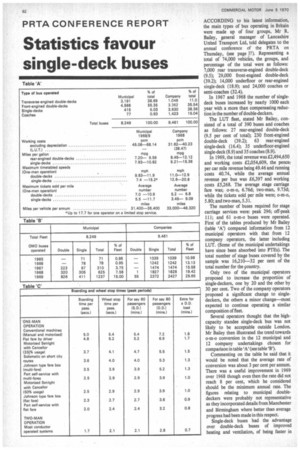
The LUT fleet, stated Mr Bailey, consisted of a total of 390 buses and coaches as follows: 27 rear-engined double-deck (9.5 per cent of total); 230 front-engined double-deck (39.2); 63 rear-engined single-deck (16.4); 35 underfloor-engined single-deck (8.9) and 35 coaches (8.9).
In 1969, the total revenue was £2,494,650 and working costs £.2,054,609, the pence( per car mile revenue being 49.46 and running costs 40.74, while the average annual revenue per bus was £6,397 and working costs £5,268. The average stage carriage fare was; o-m-o, 6.76d; two-man, 9.73d; while the tickets sold per mile were; o-m-o, 5.80; and two-man, 5.31.
The number of buses required for stage carriage services were: peak 296; off-peak 111; and 61 o-m-o buses were operated. First of the tables produced by Mr Bailey (table 'A') compared information from 12 municipal operators with that from 12 company operators, the latter including LUT. (Some of the municipal undertakings have since been absorbed into PTEs). The total number of stage buses covered by the sample was 16,210-32 per cent of the total number for the ountry.
Only two of the municipal operators proposed to increase the proportion of single-deckers, one by 20 and the other by 30 per cent. Two of the company operators proposed a significant change to singledeckers, the others a minor change-most expected to continue operating a similar composition of fleet.
Several operators thought that the highcapacity standee single-deck bus was not likely to be acceptable outside London. Mr Bailey then illustrated the trend towards o-m-o conversion in the 12 municipal and 12 company undertakings chosen for comparison in table 'A' (see table '13').
Commenting on the table he said that it would be noted that the average rate of conversion was about 3 per cent per annum. There was a useful improvement in 1969 over 1968 though even then the rate did not reach 8 per cent, which he considered should be the minimum annual rate. The figures relating to municipal doubledeckers were probably not representative as they incorporated details from Manchester and Birmingham where better than average progress had been made in this respect.
Single-deck buses had the advantage over double-deck buses of improved heating and ventilation, of being faster in operation as they had greater acceleration and carried fewer passengers, had more headroom and, of course, no stairs for passengers to negotiate. The main question, however, said Mr Bailey, was whether or not o-m-o double-deckers could be worked satisfactorily. The major difficulty was the increase in "wheel stop" time during peak periods, although such traffic normally boarded quickly.
Comparison of systems He then referred to table 'C', which compares boarding and wheel stop times with o-m-o buses equipped with different types of fare collection systems, together with crew operated buses. Wheel stop times were described as the average time for boarding plus the average time per boarding passenger in respect of delays caused by alighting passengers. All these times increased by an average of 0.6 seconds per passenger where a centre exit was not provided.
Commenting on the Johnson-type fare box, Mr Bailey said it appeared to be the most suitable system for flat fare services, but he was very doubtful about its suitability for multi-fares. Revenue losses were likely to increase from around 4 per cent to 8 per cent with this system, as with the multifare autoslot system. With the former system all passengers had to pass the driver and he felt this ought to be avoided Actual checks taken on two LUT services, employing TIM Manual ticket machines, were shown in table 'D'. This revealed that the number of stops on both services were similar and that the improved acceleration of the single-deck o-m-o bus almost balanced the increased time at stops compared with a crew-operated double-decker. Owing to the density of traffic on Service B, however, he did not think it worthwhile to operate o-m-o double-deckers without a much improved ticket system as there was very little layover.
In this connection, he favoured the • multi-journey ticket as used in Leeds, Newcastle and Liverpool which could take around 50 per cent of the ticket issuing time from the driver and 55 per cent if such tickets could be purchased by self-service. Such tickets normally had to provide a discount to make them attractive to passengers.
Where a surcharge was made during peaks, such as by the SELNEC PTE, this could be increased and then reduced back to what would be a normal surcharge for regular peak period passengers, holding multijourney tickets. This would obviate any reduction in revenue by using such tickets.
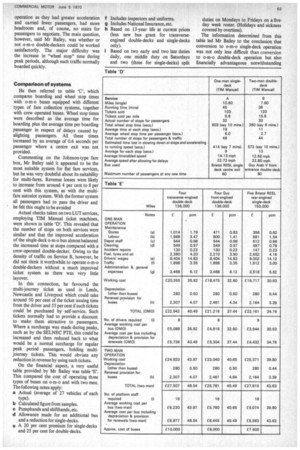
On the financial aspect, a very useful table provided by Mr Bailey was table 'E'.
This compared the cost of operating three types of buses on o-m-o and with two men. The following notes apply: a Actual (average of 27 vehicles of each type).
b Calculated figure from samples.
c Pumphands and shifthands, etc.
d Allowance made for an additional bus and a reduction for single-decks.
a A 20 per cent premium for single-decks and 25 per cent for double-decks. f Includes inspectors and uniforms.
g Includes National Insurance, etc.
h Based on 13-year life at current prices (less new bus grant for transverseengined double-decks and single-decks only).
i Based on two early and two late duties daily, one middle duty on Saturdays and two (three for single-decks) split duties on Mondays to Fridays on a fiveday week roster. (Holidays and sickness covered by overtime).
The information determined from this table led Mr Bailey to the conclusion that conversion to o-m-o single-deck operation was not only less difficult than conversion to o-m-o double-deck operation but also financially advantageous notwithstanding that 25 per cent more buses might be required (though during peak hours only).
Training in transport On Wednesday, Mr K. C. Turner, chairman of the Road Transport Industry Training Board, had presented a paper entitled "Industrial training in the road passenger transport industry". During the course of his paper he said that one surprising feature in an industry so heavily committed to training was the disparity in training times discovered by the RTITB's initial surveys. Times varied between six days and six weeks for drivers and between six and 15 days for conductors; some training methods did not reflect an optimum return on investment.
Perhaps there had been no fundamental re-examination of training methods in the industry as a whole, and the reasons for this could be identified. Most instructional staff came into the industry many years ago and had progressed through seniority. As recruits they had had higher innate ability than current entrants, and ability had largely compensated for lack of formal training as instructors. The changing situation could be summarized as follows: Training programmes and methods had evolved over many years, had become traditional, if not outdated, and needed fundamental re-examination. Many of the instructors were nearing retirement and there was a shortage of men of equal ability to replace them.
A reappraisal of content and method based upon modem analytical methods of operative training would lead to shorter training times. Mr Turner thought it remarkable that apparently well experienced instructors had admitted to learning a great deal more about training techniques slier attending courses at Motec and felt that this should encourage them to put forward their successors for formal training at the right time.
Board staff had noticed that training was based on outline syllabuses, but rarely was any attempt made to develop this with a detailed training programme. The instructor was all too often left to make his own way and frequently had little supporting material apart from his own experience. "Perhaps experience per se is too expensive a mentor in the 20th century," he said.
Selection The Board's specialist officers now had sufficient experience to suggest some areas in which improvements could be made and economies achieved in driver training. For example, one instructor to two trainees appeared to produce the best results, a view confirmed by a recent interim report on a driver training research project carfied out in the largest undertaking in the country.
Job analysis was a technique little used; a correct analysis would enable a company to identify clearly what needed to be taught. At times the most elementary mistakes were being made. The Board's staff had come across a number of cases where a considerable time in driver training had been devoted to route familiarization, when the trainees were conductors who had travelled the routes many times!