 1
1 2
2 3
3 4
4 5
5 6
6 7
7 8
8 9
9 10
10 11
11 12
12 13
13 14
14 15
15 16
16 17
17 18
18 19
19 20
20 21
21 22
22 23
23 24
24 25
25 26
26 27
27 28
28 29
29 30
30 31
31 32
32 33
33 34
34 35
35 36
36 37
37 38
38 39
39 40
40 41
41 42
42 43
43 44
44 45
45 46
46 47
47 48
48 49
49 50
50 51
51 52
52 53
53 54
54 55
55 56
56 57
57 58
58 59
59 60
60 61
61 62
62 63
63 64
64 65
65 66
66 67
67 68
68 69
69 70
70 71
71 72
72 73
73 74
74 75
75 76
76 77
77 78
78 79
79 80
80 81
81 82
82 83
83 84
84 85
85 86
86 87
87 88
88 89
89 90
90 91
91 92
92 93
93 94
94 95
95 96
96 97
97 98
98 99
99 100
100 101
101 102
102 103
103 104
104 105
105 106
106 107
107 108
108 109
109 110
110 111
111 112
112 113
113 114
114 115
115 116
116 117
117 118
118 119
119 120
120 121
121 122
122 123
123 124
124 125
125 126
126 127
127 128
128 129
129 130
130 131
131 132
132 133
133 134
134 135
135 136
136 137
137 138
138 139
139 140
140 141
141 142
142 143
143 144
144 145
145 146
146 147
147 148
148 149
149 150
150 costing for maximum profit
Page 43
Page 44
If you've noticed an error in this article please click here to report it so we can fix it.
16. Setting performance standards through budgetary control
We have seen how driver/vehicle performance can fluctuate so wildly that any one month's results is suspect; consequently, as no useful purpose can be served in using a single month's figures on which to base future results, we have to decide on the minimum number of months' costs to assemble before a reliable pattern can emerge. As a guideline, however, the time span required will depend to a large extent on the number of vehicles employed, e.g. the more there are then the shorter the period required.
In the specimen six vehicle/trailer fleet I have used, I would regard six months as the minimum period on which to build a cost history, but if sixty units were involved an average pattern WOULD START to emerge after say four months. In any event, the longer the cost history the more reliable the figures become as during the process of assembling cumulative costs you are providing for the average driver.
By modifying the headings to the first and third columns of Form R.B.7 to read "Months" and "Work Days" respectively as was illustrated in the "Projected Operating Results" (CM November 21) you can transfer your monthly vehicle group totals to the modified form R.B.7 and so provide cumulative results through a progressive build-up of performance/operating costs to date. Ideally, the cumulative figures should coincide with the company's financial year, but whenever the Flow-Line System is installed the cumulative figures should be ruled off at the end of the financial year, and then carried forward to the commencement of the next.
This is the culmination cost-wise of all that has gone before, from individual vehicle costing through to monthly fleet performances and finally cumulative operating results. Thus, over a given period of time and under any expense head, cost movements can be traced, trends detected, vehicle selection and utilisation evaluated and a firm basis provided to budget-legislation apartfuture operating costs for the Own Account Operator and profit potential for the Haulier. Thus fortified, those Own Account Operators who are pausing to consider if they should be involved in the complex business of operating their own transport are certainly better equipped to reach a decision, based on economic grounds, than those who are considering the same prospect in blissful ignorance.
Over the past few months, the cost analyst has assembled so much information within the time allotted to him-one hour per vehicle/month-that he is now in a position to put his statistics to useful purpose in the area of management accounting whether it be for the Haulier or the Own Account Operator. For the former, his objective would be to present Management with acceptable standards of performance in output and cost in order to produce the maximum profit. For the Own Account Operator he will recommend the introduction of budgets designed to produce the optimum ratio of transport cost to turnover. Moreover, he is in a position to compare his own calculated unit costs with the rates that would be charged by a reputable Haulier able to undertake all or part of the work.
Before illustrating the budgets or performance standards employed in each operation, one must point out certain principles common to both, such as: 1. The working week constitutes five days; thus, excluding Saturdays, Sundays and public holidays, there will be some 254 working days available. From this number, '14 days will be deducted for vehicle inspection and maintenance, so throughout the year there will be 240 working days which must be gainfully employed at an average rate of 20 days per month, over which period the standing costs are spread.
2. The effect of the reduction in drivers' hours, operative from the 1st March next, is reflected in both operational schedules and on which basis the budgeted standing costs per hour have been calculated. 3. As both fleets are identical, the budgeted monthly operating costs are the same for each operation and it is presupposed that the monthly mileages are the same for each.
4. The inclusion of the actual operating performance and cost per vehicle has been based on the previously published January results, but it must be assumed that the budget figures have arisen from a cost history developed over a period of six months.
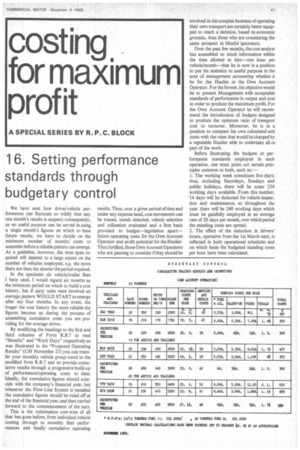
Before scrutinizing the "own account" figures, I must draw your attention to the "Units or tons delivered" column, as for each vehicle the "Sales Value" figures included on Form R.B.7 have been converted to tonnage at the rate of £60 per ton as advised to the cost analyst. Consequently the same treatment has been projected in the budget, e.g. 200 tons = £12,000.
Budgetary Control
Close study of the budgets introduced for each group of vehicles reveals some interesting comparisons with the "actual" trading pattern, bearing in mind that the budget provides for 100% utilisation over an average of 20 working days per month. You may recollect also that the cost analyst had been told by Management that built into the product price was an estimated 2.00% for the cost of transport, a figure which was thought to be adequate, although the cost ratios recently calculated over a period of four months indicated that a more accurate assessment would have been 2.5%. At first sight this may not appear to be a serious disparity until you stop to think that it is 25% more than the provision made. To prove this point, the cost analyst prepared the adjacent statistics for Management in order to emphasise that in money terms 2.00% represented a further squeeze on an already tight profit margin, despite the fact that only six operating units are involved.
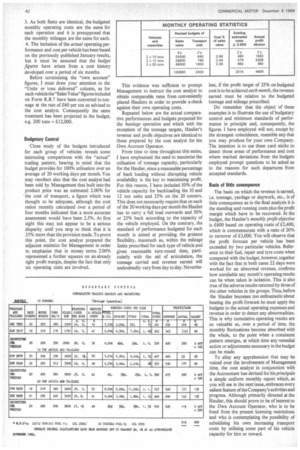
This evidence was sufficient to prompt Management to instruct the cost analyst to obtain comparable rates from conveniently placed Hauliers in order to provide a check against their own operating costs.
Repeated below are the actual comparative performances and budgets projected for the haulage operation and which with the exception of the tonnage targets, Haulier's revenue and profit objectives are identical to those prepared by the cost analyst for the Own Account Operator.
From time to time throughout this series, I have emphasised the need to maximise the utilisation of tonnage capacity, particularly for the Haulier, since a reasonable percentage of back loading without disrupting vehicle availability is the key to maximising profit. For this reason, I have included 50% of the vehicle capacity for backloading the 10 and 12 ton units and 25% on the 20 tonners. This does not necessarily require that on each of the 20 working days per month the Haulier has to carry a full load outwards and 50% or 25% back according to the capacity of the vehicle employed. On the contrary, the standard of performance budgeted for each month is aimed at providing the greatest flexibility, inasmuch as, within the mileage limits prescribed for each type of vehicle and given reasonable turn-round time, particularly with the aid of articulation, the tonnage carried and revenue earned will undoubtedly vary from day to day. Neverthe less, if the profit target of 25% on budgeted cost is to be achieved each month, the revenue earned must be relative to the budgeted tonnage and mileage prescribed.
Do remember that the object of these examples is to illustrate the use of budgetary control and minimum standards of performance in principle and, consequently, the figures 1 have employed will not, except by the strangest coincidence, resemble any that you may produce for your own Company. The intention is to use these yard sticks to detect those areas of performance and cost where marked deviations from the budgets employed prompt questions to be asked as to the reasons for such departures from accepted standards.
Basis of little consequence
The basis on which the revenue is earned, i.e. tonnage, yardage or daywork, etc., is of little consequence as in the final analysis it is the standing and running costs plus the profit margin which have to be recovered. In the budget, the Haulier's monthly profit objective is £600 based on operating costs of £2,400, which is commensurate with a ratio of 20% to turnover of £3,000. You will observe that the profit forecast per vehicle has been exceeded by two particular vehicles. Reference to their fuel, repair and tyre costs when compared with the budget, however, together with the fact that in both cases 22 days were worked for an abnormal revenue, confirms how unreliable any month's operating results can be when taken in isolation. This is also true of the adverse results returned by three of the other vehicles in the groups. Thus, before the Haulier becomes too enthusiastic about beating the profit forecast he must apply the budgets to the actual operating expenses and revenue in order to detect any abnormalities. This is why cumulative operating results are so valuable as, over a period of time, the monthly fluctuations become absorbed with the whole, to the point when a consistent pattern emerges, at which time any remedial action or adjustments necessary in the budget can be made.
To allay any apprehension that may be voiced over the involvement of Management time, the cost analyst in conjunction with the Accountant has devised for his principals a simple uniform monthly report which, as you will see in the next issue, embraces every salient feature of the Company's activities and progress. Although primarily directed at the Haulier, this should prove to be of interest to the Own Account Operator, who is to be freed from the present licensing restrictions and who is contemplating the possibility of subsidising his own increasing transport costs by utilising some part of his vehicle capacity for hire or reward.