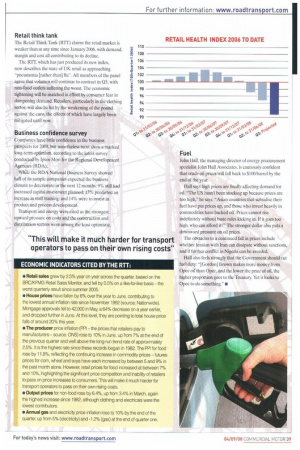
ECONOMIC INDICATORS CITED BY THE RTT:
Page 39

If you've noticed an error in this article please click here to report it so we can fix it.
• Retail sales grew by 2.5% year on year across the quarter, based on the BRC/KPMG Retail Sales Monitor, and fell by 0.5% on a like-for-like basis-the worst quarterly result since summer 2005.
• House prices have fallen by 6% over the year to June, contributing to the lowest annual inflation rate since November 1992 (source: Nationwide). Mortgage approvals fell to 42,000 in May, a 64% decrease on a year earlier, and dropped further in June. At this level, they are pointing to total house price fats of around 20% this year.
• The producer price inflation (PPI -the prices that retailers pay to manufacturers source: ONS) rose to 10% in June, up from 7% at the end of the previous quarter and well above the long-run trend rate of approximately 2.5%. It is the highest rate since these records began in 1982. The PH for food rose by 11.8%, reflecting the continuing increase in commodity prices futures prices for corn, wheat and soya have each increased by between 5 and 9% in the past month alone. However, retail prices for food increased at between 7% and 10%, highlighting the significant price competition and inability of retailers to pass on price increases to consumers. This will make it much harder for transport operators to pass on their own rising costs.
• Output prices for non-food rose by 6.4%, up from 3.4% in March, again the highest increase since 1982, although clothing and electricals were the lowest contributors.
• Annual gas and electricity price inflation rose to 10% by the end of the quarter, up from 5% (electricity) and -1.2% (gas) at the end of quarter one.


