


Costing Interpretations
Page 65
Page 66
If you've noticed an error in this article please click here to report it so we can fix it.
Whilst Operators Should Strive for the Utmost Accuracy When Recording Expenditure, Correct Assessment of the Ultimate Results is Equally Important THE results obtained from costing the operation of commercial vehicles can serve several purposes. Before entering into the transport industry prudent would-be operators will endeavour to estimate their likely costs so as to form a basis on which to quote charges to prospective customers. Many inquiries from readers confirm this, and often contain optimistic forecasts as to what they consider would be their probable costs which, in practice, will almost certainly prove unobtainable or. at best. of short duration.
But even when would-be entrants into the industry appreciate that many long-established operators have based their success on a judicious balance between competitive quotations and sound costing there remains the obvious disadvantage that they have had no practical experience of running their own vehicles and consequently no data on which to base accurate forecasts. On these occasions the existence of "The Commercial Motor" Tables of Operating Costs can prove invaluable by providing an interim standard on which to base these early estimates. Later, sufficient data peculiar to each operator's own particular circumstances can be accumulated and adjustments to estimates then made when it is considered advisable IN contrast, the established haulier or public service vehicle operator will have had the opportunity to acquire a substantial amount of information relative to the expenditure incurred in the operation of his vehicles. From time to time. adjustments will no doubt have been necessary on account of price changes, wage adjustments and for similar reasons. Additionally, with increasing experience, the margin between initial estimates and actual expenditure incurred should be steadily reduced. Also, the range of vehicles for which costings are available will increase for each operator correspondingly with the growth of his fleet.
. Despite this accumulation of costing data. however, there will nevertheless be occasions when even an experienced operator or ancillary user may wish to have an impartial yardstick by which to measure, at regular intervals, the standard of efficiency achieved by his fleet. Alternatively, the possibility of carrying new traffic may necessitate submitting quotations involving the use of types or sizes of vehicles not previously operated. In both sets of circumstances the existence of "The Commercial Motor" Tables of Operating Costs can prove of a substantial assistance to operators.
To obtain the maximum benefit from the use of these Tables. however, it is necessary to appreciate fully the principles on which such costings are based. Additionally, practical experience of transport operation is essential if correct interpretation and emphasis is to be given to the results obtained from costings.
From 50 years' experience in publishing operating costs, it has been found convenient in both "The Commercial Motor" Tables and this series of articles, to break down the total direct costs of operating a commercial vehicle into two main groups. termed "Standing Costs" and "Running Costs." The first group is further subdivided into five items, namely, licences. wages. rent and rates, insurance and interest. Similarly, running costs consist of a further five items—fuel, lubricants. tyres. maintenance, and depreciation.
This basic division into two main groups reflects the two functional aspects of commercial vehicle operation, namely, whether they are stationary or moving. The significance of this division relative to total costs is especially pertinent under the prevailing conditions of increasing traffic delays and restrictions and. in consequence. greater non-productive standing time.
'I in turn, results in less vehicle usage compared with what was originally planned. Alternatively, if the amount of work originally scheduled is nevertheless to be accomplished. additional time must be allowed. In either case the cost per mile--and ultimately the cost per unit delivered—must increase.
Although the division of total operating costs into the 10 items of expenditure just enumerated has proved convenient for many years, it must always be remembered when dealing with problems relating to the cost of running vehicles, that any such division must be—at least to some extent—arbitrary. Several of the items are, in fact, inter-related so that adjustment of any one may have repercussions on others. If this is not fully appreciated. disappointment could result if some saving, both planned and achieved, relative to one or more items of expenditure were balanced out by unexpected increases in other directions.
Similarly. whilst the terms used to describe these 10 items ot cost are generally understood, they could prove misleading if taken too literally. For example, the expression "Standing Costs" is meant to describe expenditure incurred on a vehicle throughout the period it is in the operator's possession. It follows from this that this term is a slight misnomer as expenditure continues on the five items in this group, whether the vehicle is standing or running.
In contrast. the expression "Running Costs" describes precisely the expenditure to which it refers and which does, in fact, vary directly in relation to mileage run. with only minor exceptions in a limited number of circumstances.
By combining standing and running costs into total operating costs a significant factor arises relative to the variation in the total operating cost per mile as mileage increases or decreases. Because the total standing cost per year, per week or per hour as the case may be is a fixed amount, it follows that as the mileage increases the standing cost per mile will decrease. Running costs per mile, however, with possibly only minor exceptions, remain the same.
As a result, total operating costs per mile become lower as the mileage increases, though not at the same rate as the standing cost per mile is reduced at similar mileages. Full appreciation of this aspect of costing is vital to successful operation, since it is the essence of overall profitability. Not only does the maximum use of vehicles imply increased revenue, because of the greater amount of traffic carried but, simultaneously, the operating cost per mile is reduced. It then follows that overall the rate of profitability is higher.
As an example of the relative proportion of these 10 items of operating costs, I now give current coatings of two popular types of vehicles, namely, a 5-ton petrol-engined goods vehicle and a 13-ton rigid oiler.
Dealing first with the smaller vehicle, it will be assumed that the initial outlay is around £1,090. An unladen weight of 2 tons 12 cwt. would incur an annual licence duty of £39, or the equivalent of 16s. 5d, a week. This is on the basis of a 50-week year to allow for two weeks per annum when the vehicle may be off the road on account of major overhaul or the driver's annual holiday.
Wages are reckoned to cost the operator £9 14s. 10d. a 44-hour week. This is based on the current Road Haulage Wages Regulation R.H.(70) as applicable to vehicles based in Grade 1 areas. The amount includes allowances for employers' contributions to both the new Graduated Pension and National Insurance and voluntary employers' indemnity insurance, whilst an appropriate adjustment is made to include the cost of holidays with pay.
Rent and rates in respect of garaging the vehicle arc nominally assessed at I Is. 10d. a week, whilst vehicle insurance adds the equivalent of £2 Os. Id. a week. This amount is calculated on the basis of an annual premium of £100 4s., as applicable to A-licence operation in Grade I areas.
Interest charged at a rate of 5 per cent on the initial outlay of £1,090 would cost £1 Is. 9d. a week. The total for these five items of standing costs would, therefore, be £14 4s. I Id. Assuming that this 5-tonner averaged 400 miles a week, the corresponding standing cost per mile would be 8.55d.
TN contrast to standing costs, which in this instance arc calcu lated on a weekly basis, running costs are initially worked out as a cost per mile. Assuming that petrol was purchased in bulk by this particular operator at 3s. 104. a gallon and that an average rate of consumption of 12 m.p.g. was maintained, the fuel cost per mile would be 3.83d. Lubricants add 0.224. a mile.
Assuming a set of tyres for this vehicle costs £158 and that a life of 30,000 miles per set is achieved, the tyre cost per mile would be I.26d. Maintenance is reckoned to cost 2.56d. a mile, inclusive of washing, servicing and major repairs.
In order to obtain the balance to be written off as depreciation, it is first necessary to deduct the equivalent cost of the original set of tyres from the initial price of the vehicle. Having made a further deduction in respect of the estimated residual value, the resulting balance of £823 is divided by the appropriate figure of the estimated mileage life of the vehicle, which in this instance is 150,000. This gives a depreciation cost per mile of 1.32d. The addition of these five items gives a total running cost per mile of 9.19d. which, when added to the standing cost of MSd., gives a total operating cost per mile of 17.74d.
With a weekly mileage of 400, the corresponding running costs per week would be: fuel, £6 7s. 84.; lubricants, 7s. 44.; tyres, -2 2s.; maintenance. £4 5s. 44.; and depreciation, £2 4s.: total, £15 6s. 44. Added to the standing costs, this gives a total costs Of £29 II s. 3d., when averaging 400 miles a week with this 5-tonner.
It Will be noted that, even when the driver is paid only for a basic week of 44 hours, as at present applies, the .proportion of the amount paid in wages per week relative -to the total operating cost is 32.95 per cent. Fuel accounts for 21.59 per cent., so that these two items together.amount to more than half the operating cost.
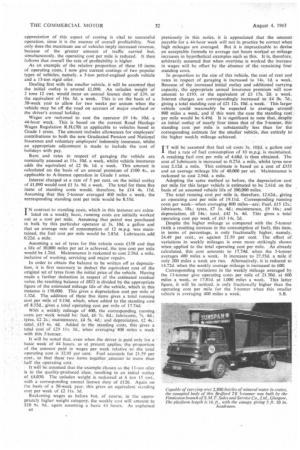
It will be assumed that the example chosen as the 13-ton oiler is in the quality-produced class, resulting in an initial outlay of £4,030. The unladen weight is reckoned at 6 ton 15 cwt., with a corresponding annual licence duty of £126. Again on the basis of a 50-week year. this gives an equivalent standing cost per week of £2 I Is. 3d.
Reckoning wages as before but, of course, in the appropriately higher weight category, the weekly cost will amount to £10 9s. 94.. again assuming a basic 44 hours. As explained nr1 previously in this series, it is appreciated that the amount payable for a 44-hour week will not in practice be correct when high mileages are averaged. But it is impracticable to devise an acceptable formula to average out hours worked as mileage increases in hypothetical examples such as this. It is, therefore, arbitrarily assumed that when overtime is worked the increase in wages will be offset by the absence of the remaining four standing costs.
In proportion to the size of this vehicle, the cost of rent and rates in respect of garaging is increased to 14s. Id. •a week. Because of the increased initial outlay and additional carrying capacity, the appropriate annual insurance premium will now amount to £193 or the equivalent of £3 17s. 24. a week. Interest charges are correspondingly increased to £4 Os. 7d., giving a total standing cost of £21 12s. 10d. a week. This larger vehicle could reasonably be expected to average around. 800 miles a week, and if this were the-case the standing cost per mile would be 6.49d. It is significant to note that,-despite an initial outlay of nearly four times that of the 5-tonner, this standing cost per mile is substantially less than for the corresponding estimate for the smaller vehicle, due entirely to the higher weekly mileage achieved.
T T will be assumed that fuel oil costs 35. 101d. a gallon and I that a rate of fuel consumption of 10 m.p.g. is maintained. A resulting fuel cost per mile of 4.68d. is then obtained. The cost of lubricants is increased to 0.27d. a mile, whilst tyres now cost 2.I24. a mile. This estimate is based on a cost of £353 and an average mileage life of 40,000 per set Maintenance is reckoned to cost 2.94d. a mile.
Adopting the same method as before, the depreciation cost per mile for this larger vehicle is estimated to be 2.61d. on the basis of an assumed vehicle life of 300,000 miles.
The total running cost per mile is, therefore, 12.62d., giving an operating cost per mile of 19.1Id. Corresponding running costs per week-when averaging 800 miles-are: Fuel, £15 12s.; lubricants, 18s.: tyres, £7 Is. 441; maintenance, £9 l6s.; and depreciation, £8 14s.: total. £42 Is. 44. This gives a total operating cost per week of £63 14s. 24.
Despite the higher mileage as compared with the 5-tonner (with a resulting increase in the consumption of fuel), this item, in terms of percentage, is only fractionally higher, namely. 24.49 per cent., as against 21.59 per cent. The effect of variations in weekly mileages is even more strikingly shown when applied to the total operating cost per mile. As already calculated, this cost amounts to 17.744. when the Stormer averages 400 miles a week. It increases to 27.55d. a mile if only 200 miles a week are run. Alternatively, it is reduced to 14.72d. when the weekly average mileage is increased to 600.
Corresponding variations in the weekly mileage averaged by the 13-tonner give operating costs per mile of 21.50d. at 600 miles a week, or 17.8I4. at 1,000 miles a week. This latter figure, it will be noticed, is only fractionally higher than the operating cost per mile for the 5-tonner when this smaller vehicle is averaging 400 miles a week. S.B.