 1
1 2
2 3
3 4
4 5
5 6
6 7
7 8
8 9
9 10
10 11
11 12
12 13
13 14
14 15
15 16
16 17
17 18
18 19
19 20
20 21
21 22
22 23
23 24
24 25
25 26
26 27
27 28
28 29
29 30
30 31
31 32
32 33
33 34
34 35
35 36
36 37
37 38
38 39
39 40
40 41
41 42
42 43
43 44
44 45
45 46
46 47
47 48
48 49
49 50
50 51
51 52
52 53
53 54
54 55
55 56
56 57
57 58
58 59
59 60
60 61
61 62
62 63
63 64
64 65
65 66
66 67
67 68
68 69
69 70
70 71
71 72
72 73
73 74
74 75
75 76
76 77
77 78
78 79
79 80
80 81
81 82
82 83
83 84
84 85
85 86
86 87
87 88
88 89
89 90
90 91
91 92
92 93
93 94
94 95
95 96
96 97
97 98
98 99
99 100
100 101
101 102
102 103
103 104
104 105
105 106
106 107
107 108
108 109
109 110
110 111
111 112
112 113
113 114
114 115
115 116
116 117
117 118
118 119
119 120
120 121
121 122
122 123
123 124
124 125
125 126
126 127
127 128
128 129
129 130
130 131
131 132
132 133
133 134
134 135
135 136
136 137
137 138
138 139
139 140
140 141
141 142
142 143
143 144
144 145
145 146
146 147
147 148
148 149
149 150
150 151
151 152
152 153
153 154
154 155
155 156
156 157
157 158
158 159
159 160
160 161
161 162
162 163
163 164
164 165
165 166
166 167
167 168
168 169
169 170
170 171
171 172
172 173
173 174
174 175
175 176
176 177
177 178
178 179
179 180
180 181
181 182
182 183
183 184
184 185
185 186
186 187
187 188
188 189
189 190
190 191
191 192
192 193
193 194
194 195
195 196
196 197
197 198
198 199
199 200
200 201
201 202
202 203
203 204
204 205
205 206
206 207
207 208
208 209
209 210
210 211
211 212
212 213
213 214
214 215
215 216
216 217
217 218
218 219
219 220
220 221
221 222
222 223
223 224
224 225
225 226
226 227
227 228
228 229
229 230
230 231
231 232
232 A VITAL, VIGOROUS
Page 110
Page 111
If you've noticed an error in this article please click here to report it so we can fix it.
and
SUCCESSFUL INDUSTRY
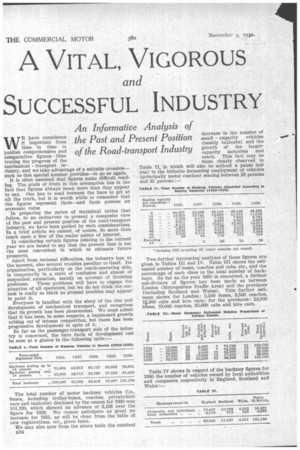
WE have considerea It important from time to time to publish comprehensive and comparative figures illustrating the progress of the thechanical transport industry, and we take advantage of a suitable occasionsuch as this special number provides-to do so again. It is often assumed that figures make difficult reading. The grain of truth in this assumption lies in the fact that figures always mean more than they appear to say. One has to read between the lines to get at all the truth, but it is worth while to remember that the figures represent facts-and facts possess aneconomic value
In preparing the series of statistical tables that follow, in an endeavour to present a composite view of the past and present position of the road-transport industry, we have been guided by such considerations. In a brief article we cannot, of course, do more than touch upon a few of the major points of interest. In considering certain figures relating to the current year we are bound to say that the present time is not the most convenient in which to estimate future prospects. Apart from national difficulties, the industry has, at the moment, also several troubles peculiar to itself. Its organization, particularly on the coach-operating side, is temporarily in a state of confusion and almost of suspended. animation, mainly on account of licensing problems. These problems will have to engage the attention of all operators, but we do not think the outlook is really so black as present troubles may appear to paint it. . Everyone is familiar with the story of the rise and development of mechanical transport, and recognizes that its growth has been phenomenal. We must admit that it has been, in some respects, a haphazard growth arising out of intense competition, but there has been progressive development in spite of it. So far as the passenger-transport side of the industry is concerned, the bare facts of development can be seen at a glance in the following table: The total number of motor hackney vehicles (i.e., buses, including trolley-buses, coaches, private-hire cars and taxicabs) disclosed by the census for 1930 was 101,130, which showed an advance of 3,133 over the figure for 1929. We cannot anticipate as great an increase for 1931, as will be clear from the table of new registrations, etc., given later. We may also note from the above table the constant decrease in the number of small capacity vehicles (mostly taxicabs) and the growth of the largercapacity motorbus and coach. This fact may be more clearly observed in Table II, in which will also be noticed a pause last year in the hitherto increasing employment of vehicles (principally motor coaches) seating between 26 persons and 32 persons : Two further interesting analyses of these figures are given in Tables III and IV. Table III shows the estimated number of buses, coaches and cabs, etc., and the percentage of each class to the total number of hackneys. So far as the year 1930 is concerned, a further sub-division of figures has been made as between London (Metropolitan Traffic Area) and the provinces (including Scotland and Wales). This further estimate shows for London: 5,500 buses, 3,500 coaches, 4 500 cabs and hire cars; for the provinces: 24,500 buses, 19,000 coaches, 35,000 cabs and hire cars.
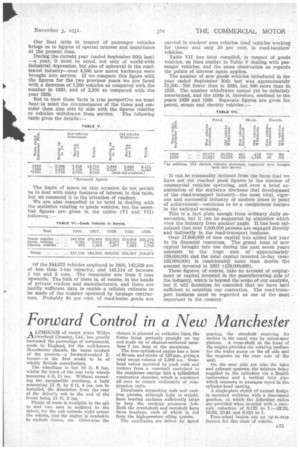
Table IV shows in respect of the hackney figures for 1930 the number of vehicles owned by local authorities and companies respectively in England, Scotland and Wales: Our final table in respect of passenger vehicles brings us to figures of special interest and importance at the present time.
During the current year (ended September 30th last) -a year, It must be noted, not only of world-wide industrial depression, but also of upheaval in the roadtravel industry-over 8,500 new motor hackneys were brought into service. if we compare this figure with the figures for the two previous years we are faced with a decrease of 1,200 vehicles as compared with the number in 1930, and of 2,200 as compared with the year 1929.
But to view these facts in true perspective we must bear in mind the circumstances of the times and consider them also side by side with the figures relating to vehicles withdrawn from service. The following table gives the details: The limits of space on this occasion do not permit us to deal with many features of interest in this table, but we commend it to the attention of readers.
We are also compelled to be brief in dealing with the statistics relating to goods vehicles, but the essential figures are given in the tables (VI and VII) following : Of the 344,672 vehicles employed in 1930, 142,529 are of less than 1-ton capacity, and 143,114 of between 1 ton and 3 tons. The remainder are from 3 tons upwards. The bulk of them is, of course, in the hands of private traders and manufacturers, and there are hardly sufficient data to enable a reliable estimate to be made of the number operated by haulage contractors. Probably 80 per cent, of road-borne goods are carried in traders' own vehicles (and vehicles working for them) and only 20 per cent. in road-hauliers' vehicles.
Table VII has been compiled, in respect of goods vehicles, on lines similar to Table V dealing with passenger vehicles, and the same observation as regards the points of interest again applies.
The number of new goods vehicles introduced in the year ended September 30th last was approximately M,500-700 fewer than in 1930, but 800 more than in 1929. The number withdrawn cannot yet be definitely ascertained, and the table is, therefore, confined to the years 1929 and 1930. Separate figures are given for petrel, steam and electric vehicles: It can be reasonably deduced from the facts that we have not yet reached peak figures in the number of commercial vehicles operating, and even a brief examination of the statistics discloses that development of the road-transport industry-the most vital, vigorous and successful industry of modern times in point of achievement-continues to be a conspicuous feature in the national economy.
This is a fact plain enough from ordinary daily observation, but it can be supported by statistics which view the industry from another angle. It has been calculated that over 1,000,000 persons are engaged directly and indirectly in the road-transport business.
Over £7,600,000 of new capital was added last year to its financial resources. The grand total of new capital brought into use during the past seven years amounts to the huge sum of approximately 138,000,000 and the total capital invested to-day (over .£63,000,000) is considerably more than double the amount invested in 1925 (128,000,000).
These figures, of course, take no account of employment or capital invested in the manufacturing side of the industry, which is beyond the scope of our analysis, but it will doubtless be conceded that we have said sufficient to establish our contention. The road-transport business must be regarded as one of the most important in the country.