


Pass masters
Page 29
Page 30
Page 31
Page 32
If you've noticed an error in this article please click here to report it so we can fix it.
As Vosa reports yet another year-on-year improvement in the annual test performance of Britain's trucks and trailers, CM digs deeper into the data By David Wilcox
THE PERFORMANCE OF Britain's trucks and trailers at their annual roadworthiness test has stepped up yet again. Test data covering the 12 months to 31 March released earlier this month in Vosa's annual Effectiveness Report shows that 77.6% of all trucks passed their test at the first attempt; the figure for trailers is 84.3% — both are all-time records. This is the sixth consecutive annual increase in the truck test pass rate and the 11th for trailers. When using the test pass rate as a key performance indicator (KPI) with customers or maintenance suppliers, it pays to clarify the definition of pass. Vosa — which counts fails rather than passes — defines the initial pass rate as the
percentage of vehicles that pass the test exactly as they are presented. That does not include those that achieve a pass after rectification at station (PRS) of minor defects — they count towards Vosa's failure rate. So this latest headline initial pass rate of 77.6% for trucks is the proportion that sailed through the test at their first attempt, completely unaided. A further 9.8% passed after minor rectifications: the remaining 12.6% were outright failures.
As originally forecast by Vosa chief executive Alastair Peoples, the introduction of authorised testing facilities (ATFs) has contributed towards this improvement — testing and maintaining vehicles at the same premises at least cuts out a journey to the test station. However, this year's results show the gap in the pass rate at Vosa and non-Vosa sites (ATFs and designated premises) is narrower than in the past couple of years. The pass rate at non-Vosa test sites is now just half of one percentage point better than at Vosa's own test stations in the case of trucks; for trailers the difference in favour of non-Vosa sites is two percentage points. In the history of truck testing in Britain, 2012/2013 was a watershed year, marking the point at which privately owned premises overtook Vosa test stations as the main provider of truck tests. Non-Vosa sites carried out 51% of truck tests and 61% of trailer tests.
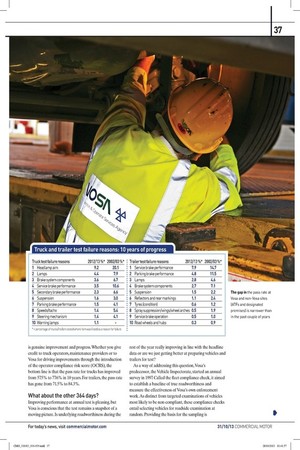
There are recent signs that the inexorable upward trend in pass rates could be slowing. Vosa's latest data for tests taken in April, May and June — the three months following the period covered by this report — show pass rates of 77% for trucks and 84.4% for trailers, suggesting that results may now be plateauing. To identify where the real improvements have come from, CM has compared Vosa's latest top 10 test failure reasons for trucks and trailers with those from a decade earlier, 2002/03 (see tables). Although the halving of the number one failure reason — headlamp aim — can be partly attributed to the easing of the aim requirements five years ago, the dramatic reductions in the other areas
is genuine improvement and progress. Whether you give credit to truck operators, maintenance providers or to Vosa for driving improvements through the introduction of the operator compliance risk score (OCRS), the bottom line is that the pass rate for trucks has improved from 57.5% to 77.6% in 10 years. For trailers, the pass rate has gone from 71.5% to 84.3%.
What about the other 364 days?
Improving performance at annual test is pleasing, but Vosa is conscious that the test remains a snapshot of a moving picture. Is underlying roadworthiness during the
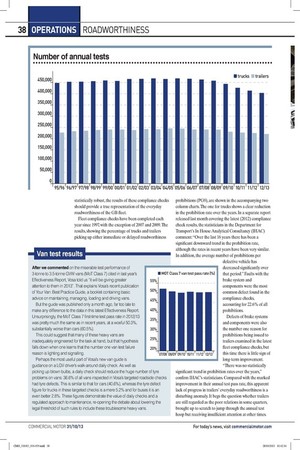
rest of the year really improving in line with the headline data or are we just getting better at preparing vehicles and trailers for test? As a way of addressing this question,Vosa's predecessor, the Vehicle Inspectorate, started an annual survey in 1997. Called the fleet compliance check, it aimed to establish a baseline of true roadworthiness and measure the effectiveness of Vosa's own enforcement work. As distinct from targeted examinations of vehicles most likely to be non-compliant, these compliance checks entail selecting vehicles for roadside examination at random. Providing the basis for the sampling is
statistically robust, the results of these compliance checks should provide a true representation of the everyday roadworthiness of the GB fleet. Fleet compliance checks have been completed each year since 1997, with the exception of 2007 and 2009. The results, showing the percentage of trucks and trailers picking up either immediate or delayed roadworthiness prohibitions (PG9), are shown in the accompanying two column charts. The one for trucks shows a clear reduction in the prohibition rate over the years. In a separate report released last month covering the latest (2012) compliance check results, the statisticians in the Department for Transport's In House Analytical Consultancy (IHAC) comment: "Over the last 16 years there has been a significant downward trend in the prohibition rate, although the rates in recent years have been very similar. In addition, the average number of prohibitions per
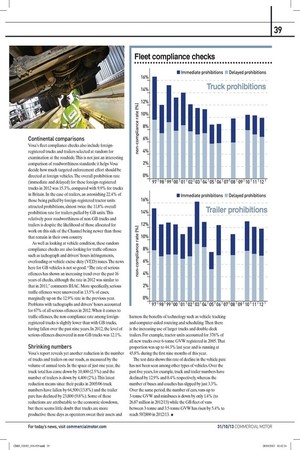
defective vehicle has decreased significantly over that period." Faults with the brake system and components were the most common defect found in the compliance checks, accounting for 22.6% of all prohibitions. Defects of brake systems and components were also the number one reason for prohibitions being issued to trailers examined in the latest fleet compliance checks, but this time there is little sign of long-term improvement. "There was no statistically
significant trend in prohibition rates over the years," confirm IHAC's statisticians. Compared with the marked improvement in their annual test pass rate, this apparent lack of progress in trailers' everyday roadworthiness is a disturbing anomaly. It begs the question whether trailers are still regarded as the poor relations in some quarters, brought up to scratch to jump through the annual test hoop but receiving insufficient attention at other times.
Continental comparisons
Vosa's fleet compliance checks also include foreignregistered trucks and trailers selected at random for examination at the roadside. This is not just an interesting comparison of roadworthiness standards: it helps Vosa decide how much targeted enforcement effort should be directed at foreign vehicles. The overall prohibition rate (immediate and delayed) for these foreign-registered trucks in 2012 was 15.3%, compared with 9.9% for trucks in Britain. In the case of trailers, an astonishing 22.4% of those being pulled by foreign-registered tractor units attracted prohibitions, almost twice the 11.8% overall prohibition rate for trailers pulled by GB units. This relatively poor roadworthiness of non-GB trucks and trailers is despite the likelihood of those allocated for work on this side of the Channel being newer than those that remain in their own country.
As well as looking at vehicle condition, these random compliance checks are also looking for traffic offences such as tachograph and drivers' hours infringements, overloading or vehicle excise duty (VED) issues. The news here for GB vehicles is not so good. "The rate of serious offences has shown an increasing trend over the past 16 years of checks, although the rate in 2012 was similar to that in 2011," comments IHAC. More specifically, serious traffic offences were uncovered in 13.5% of cases, marginally up on the 12.9% rate in the previous year. Problems with tachographs and drivers' hours accounted for 67% of all serious offences in 2012. When it comes to traffic offences, the non-compliance rate among foreignregistered trucks is slightly lower than with GB trucks, having fallen over the past nine years. In 2012, the level of serious offences discovered in non-GB trucks was 12.1%.
Shrinking numbers
Vosa's report reveals yet another reduction in the number of trucks and trailers on our roads, as measured by the volume of annual tests. In the space of just one year, the truck total has come down by 10,400 (2.5%) and the number of trailers is down by 4,400 (2%). This latest reduction means since their peaks in 2005/06 truck numbers have fallen by 64,500 (13.8%) and the trailer parc has declined by 23,800 (9.8%). Some of these reductions are attributable to the economic slowdown, but there seems little doubt that trucks are more productive these days as operators sweat their assets and
harness the benefits of technology such as vehicle tracking and computer-aided routeing and scheduling. Then there is the increasing use of larger trucks and double-deck trailers. For example, tractor units accounted for 37.6% of all new trucks over 6-tonne GVVV registered in 2005. That proportion was up to 44.3% last year and is running at 45.8% during the first nine months of this year. The test data shows this rate of decline in the vehicle parc has not been seen among other types of vehicles. Over the past five years, for example, truck and trailer numbers have declined by 12.9% and 8.4% respectively, whereas the number of buses and coaches has slipped by just 3.3%. Over the same period, the number of cars, vans up to 3-tonne GVVV and minibuses is down by only 1.4% (to 26 87 million in 2012/13) while the GB fleet of vans between 3-tonne and 3.5-tonne GVVV has risen by 5.4% to reach 587,800 in 2012/13. •