


Closing the gap
Page 52
Page 53
If you've noticed an error in this article please click here to report it so we can fix it.
The Cranfield Centre for Transport Studies aims to bring fleet operators and suppliers together. In this series, Derek Wright gets behind the jargon to explore the financial benefits of high technology
VEHICLE manufacturers recognise that operators' expenditure on maintenance is a significant part of the cost of ownership. This market potential provides a continuous impetus to product research and development. As a result, operators can expect maintenance costs to fall progressively without any loss in vehicle reliability.
The proportion of maintenance in operating costs changes with vehicle gross weight, rising from approximately 12 per cent for the average light van to about 20 per cent of all costs for trucks of over 30 tons. These costs are only marginally below those of fuel.
A nominal saving of, say, five per cent on the maintenance of the average 38-ton artic might result in annual savings close to £700 per year. However, before seeking ways to achieve these savings in the maintenance budget, it is important to recognise fully the effects that any change may cause in other areas of the business.
Maintenance costs arise because of scheduled or unscheduled repairs, ie servicing, repairs or breakdowns. We believe that the two are linked — high emphasis on preventative servicing can mean low breakdown costs. Conversely, low servicing levels may cause high unscheduled failures.
Our difficulty lies in deciding what balance of planned replacement and repair on failure leads to the lowest total operating cost.
We assume that the choices available always ensure that vehicles fully satisfy legal and safety requirements.
The nature of the problem can be explored by analysing an example. Consider the alternative strategies which are possible with servicing a component such as the vehicle air compressor. The recommendation from the vehicle or engine manufacturer may suggest a service replacement based upon 100,000-mile intervals. Adopting a scheduled approach therefore entails the renewal of all vehicle compressors as they reach mileages which are multiples of 100,000 miles. The orderly nature of our demand for compressors means that spares can be purchased on time rather than being held in stock. Workshop facilities and staff can be minimised on the basis of being able to plan the work-load.
Theoretically, spare vehicles should not be required and the situation is close to the fleet engineer's dream. The ability of this method to achieve minimum fleet operating costs depends upon all compressors having a life of precisely 100,000 miles.
The average mean time between failure (mtbf) of all compressors may, indeed, show a life of 100,000 miles, but some of the units in the fleets will have failed early and others will have been replaced needlessly.
Alternatively, compressors could be replaced upon failure. The result may be fewer replacements, but the total cost of each replacement is likely to be higher. Mechanical failure while in service will cause some disruption to the distribution of products — expensive if international connections are involved.
Failure often causes damage to other components. The random nature of the failures has knock-on effects in the operation — spare vehicles are needed to reduce the effect on customer service; workshop facilities and staff levels need to be increased to cover uncertain periods of high demand; and the inventory of spares has to be high to cover unplanned demand. The system attempts to manage the crisis and, depending on the sort of operation, it can produce lower overall costs.
Clearly, it is the nature of the relationship between the vehicle, its specification and the work it is expected to perform that dictates the precise servicing requirements. Computers' speed, arithmetical accuracy and memory capacity offer operators the ability to treat each vehicle as a cost centre. Information produced by a computer-based system could be usefully employed at the various levels of maintenance planning. We need to decide what these areas might be. The maintenance function can be conveniently divided into three elements: • Vehicle planning — scheduling and maintenance that includes prevention, demand and scheduled replacement.
• Parts planning — including ordering and stock levels.
• Manpower — allocation of mechanic skills to job requirements, monitoring levels of workshop productivity.
Management information systems — computer-based methods of generating business reports — can be employed at each of these elements.
Generally, computer information is presented in one or a combination of four ways. They are: • Scheduled listing: regular (monthly, yearly) identical report format.
• Predictive report: reports aimed at specific planning problems.
• Exception report: highlight areas of abnormal activity.
• Demand report: provide answers to specific management questions.
Most commercially available packages offer the first of these. Increasing sophistication (accompanied by higher prices) allows the others to be added. In principle, anything is on offer, including the proverbial bells and whistles.
If we are to be honest and professional, information should be purchased in the same objective manner as vehicles are replaced. The alternative methods of providing the answers should be explored.
Often with computers anc computer software there is E kudos attached to the techno. logy: in many cases manual methods could be cheaper! The important factor is deciding whether the benefits, in this case lower maintenance costs, represent a good return on the investment.
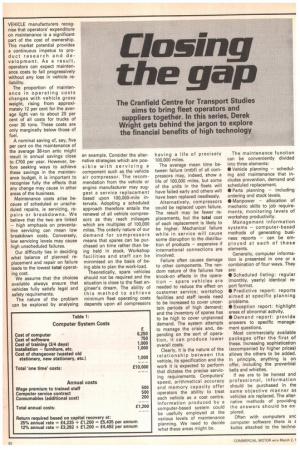
The total cost of the system must be included: training, additional stationery and costs during changeover must be added to the direct costs of the computer and printers (the hardware) and the set of operating instructions (the software programs). Table 1 shows the sort of calculation that might apply to a standard system capable of recording truck repair histories.
A system of this type would have capacity to handle a fleet of around 200 vehicles, each with a life of approximately four years. The limitations are in the main imposed by memory capacity. Consequently, if the vehicle life is expected to exceed the four years, maximum fleet size may be reduced.
The calculations show the return of savings in cost which are required to pay for the system. I have purposely used two different interest rates. Money spent in the course of business should be expected to yield a return on investment and computers ought not to be treated differently.
A reasonable rate of return on capital is 25 per cent, providing sufficient funds for the purchase of a replacement system and an allowance for the loss of investment earnings were the capital to be employed in other revenue generating areas, such as additional vehicles. The figure is also close to the true interest charged by hire purchase organisations were the system to be bought this way.
The standard rate, 12 per cent, aims to display the minimum advisable return and is similar to the cost were the system financed by increased overdraft facilities. Viability of the system depends upon the ability of the additional information to generate a reduction in maintenance costs of approximately £5,500 annually (or about £4,500 per annum at a 12 per cent rate).
Comments from vehicle manufacturers suggest that operators currently only submit approximately 25 per cent of the total possible warranty claims. Clearly, a computer keeping track of warranty claims could generate some lost revenue for many operations.
A system using the first of the report types listed earlier, a scheduled listing, could provide this type of information. Such systems would usually cost around £4,000-£5,000. Most systems can provide additional routine information, servicing plans, licence dates, MoT dates, repair costs and totals for the whole fleet.
Enhancements which provide, at added cost, replacement predictions and workshop planning are available in systems producing the second type of report — the predictive kind.
Large fleet operators can gain the advantage of exception reporting, the information being summarised to identify vehicles requiring repetitions of similar repairs, vehicles requiring replacement and the most costly vehicles.
The more sophisticated systems are capable of responding to specific request, for example, the total number of alternators fitted in the past six months. Clearly, as the level of sophistication increases then the ability to buy a standard package that matches every business operation decreases.
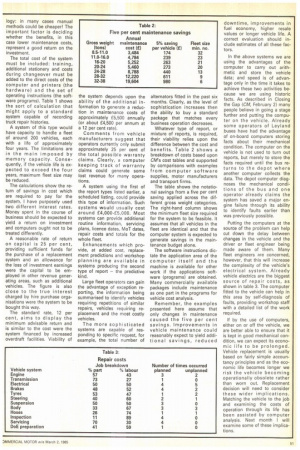
Whatever type of report, or mixture of reports, is required, their viability relies upon the difference between the cost and benefits. Table 2 shows a breakdown of costs based upon CM's cost tables and supported by comparisons with examples from computer software supplies, motor manufacturers and transport firms.
The table shows the notational savings from a five per cent saving applied across the different gross weight categories. The right-hand column shows the minimum fleet size required for the system to be feasible. It assumes that all vehicles in the fleet are identical and that the computer system is expected to generate savings in the maintenance budget alone.
The software instructions dictate the application area of the computer itself and the machine is available for other work if the applications software (programs) are obtained. Many commercially available packages include maintenance as one part in the programs for vehicle cost analysis.
Remember, the examples presented here assume that only changes in maintenance caused the five per cent savings. Improvements in vehicle maintenance could reasonably expect to yield additional savings, reduced downtime, improvements in fuel economy, higher resale values or longer vehicle life. A correct evaluation should include estimates of all these factors.
In the above systems we are using the advantages of the computer to carry out arithmetic and store the vehicle data; and speed is of advantage only in the time it takes to achieve these two activities because we are using historic facts. As described in Closing the Gap (CM, February 2) many people believe in going a stage further and putting the computer on the vehicle, Already some operators of Leyland buses have had the advantage of on-board computers storing facts about their mechanical condition. The computer on the vehicle is not used to turn out reports, but merely to store the facts required until the bus returns to the depot where another computer collects the data. The depot computer diagnoses the mechanical conditions of the bus and one operator already claims the system has saved a major engine failure through its ability to identify faults earlier than was previously possible.
Putting the computers at the source of the problem can help cut down the delay between changes in the vehicle and the driver or fleet engineer being made aware of them. Many fleet engineers are concerned, however, that this will increase the complexity of the vehicle's electrical system. Already vehicle electrics are the biggest source of repair costs, as shown in table 3. The computer fitted to the vehicle can help in this area by self-diagnosis of faults, providing workshop staff with a detailed list of the work required.
If by the use of computers, either on or off the vehicle, we are better able to ensure that it is kept in good mechanical condition, we can expect its economic life to be prolonged. Vehicle replacement is usually based on fairly simple accountancy principles and as the economic life becomes longer we risk the vehicle becoming operationally obsolete rather than worn out. Replacement decision will need to consider these wider implications. Matching the vehicle to the job and examining the costs of operation through its life has been assisted by computer analysis. Next month I will examine some of these implications.