 1
1 2
2 3
3 4
4 5
5 6
6 7
7 8
8 9
9 10
10 11
11 12
12 13
13 14
14 15
15 16
16 17
17 18
18 19
19 20
20 21
21 22
22 23
23 24
24 25
25 26
26 27
27 28
28 29
29 30
30 31
31 32
32 33
33 34
34 35
35 36
36 37
37 38
38 39
39 40
40 41
41 42
42 43
43 44
44 45
45 46
46 47
47 48
48 49
49 50
50 51
51 52
52 53
53 54
54 55
55 56
56 57
57 58
58 59
59 60
60 61
61 62
62 63
63 64
64 65
65 66
66 67
67 68
68 69
69 70
70 71
71 72
72 73
73 74
74 75
75 76
76 77
77 78
78 79
79 80
80 81
81 82
82 83
83 84
84 85
85 86
86 87
87 88
88 89
89 90
90 91
91 92
92 93
93 94
94 95
95 96
96 97
97 98
98 99
99 100
100 101
101 102
102 103
103 104
104 105
105 106
106 107
107 108
108 109
109 110
110 111
111 112
112 113
113 114
114 115
115 116
116 117
117 118
118 119
119 120
120 121
121 122
122 123
123 124
124 125
125 126
126 127
127 128
128 129
129 130
130 131
131 132
132 133
133 134
134 135
135 136
136 137
137 138
138 139
139 140
140 141
141 142
142 143
143 144
144 145
145 146
146 147
147 148
148 149
149 150
150 151
151 152
152 153
153 154
154 155
155 156
156 157
157 158
158 159
159 160
160 161
161 162
162 163
163 164
164 165
165 166
166 167
167 168
168 169
169 170
170 171
171 172
172 173
173 174
174 175
175 176
176 177
177 178
178 179
179 180
180 181
181 182
182 183
183 184
184 WHERE COMMERCIAI VEHICLES GO
Page 114
Page 115
If you've noticed an error in this article please click here to report it so we can fix it.
THE occasion of the Commercial Motor Show virtually marks for most manufacturers the beginning of a new trading year, and it is, therefore, perhaps the most fitting one for an excursion into the statistics of the industry. Statistics, as we _all know, can be as dry as dust, but they can also be of the greatest importance. It all depends upon the way one considers thern.
We propose to extract, to analyse and consider some of the statistics contained in returns published by the Ministry of Transport. The facts to be gleaned from them constitute, without question, some of the most essential information required by those engaged in the industry.
Among the most instructive of these returns is that of the census of vehicles, for which licences are current at any time during the quarter ended September 30 in each year. This publication also shows the numbers of vehicles registered for the first time during the year ended at that date.
Nearly 3,000,000 Vehicles Licensed The latest of such returns. available at present is for the period ended September 30, 1936. The fact that the. figures are now more than a year old does not detract from their value, because the manner in which we propose to use them is purely comparative.
The return shows that the total number of mechanically propelled vehicles for which licences were current at any time during the quarter ended September 30, 1936, was 2,768,606. (In passing, it may be stated that this figure compares with a total of 2,881,034 at August 31, 1937.) Omitting private cars (1,642.850), motorcycles (505,779), agricultural engines, such as ploughing, mowing and trench-digging machines (22,123), invalid carriages (1,698) and tramcars (10,260), we arrive at the fact that the commercial-motor industry was, in 1936, represented on -the roads of Britain by 585,896 vehicles. (At August 31, 1937, that number had grown to 622,435.) Compared with the census of 1934, the figure shows an increase of 55,147 vehicles. That points to the measure of the industry's growth in two years; but not, it is important to note, the extent of the industry's output, even so far as the home country is concerned. For this measure we may turn to the figures of new registrations.
New Registrations Approach 500,000 During the year ended September 30, 1936, 449,339 vehicles in all were registered for the first time. Again omitting private cars (295,967), motorcycles (53,387), agricultural engines (5,177) and invalid carriages (219), we have a total of 94,589 new vehicles remaining to the credit of the commercial-motor industry.
In 1935, the corresponding number of new commercial vehicles was 80,790, so that, in the two years, during which the net increase in total numbers amounted to 55,147 vehicles, the new vehicles intro
c52 duced numbered 175,379. It follows, as a matter of course, that no fewer than 120,232 were " replacement " vehicles-an average of over 60,000 a year.
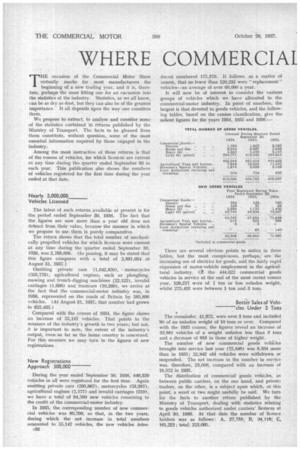
It will now be of interest to consider the various groups of vehicles which we have allocated to the commercial-motor industry. In point of numbers, the largest is that devoted to goods vehicles, and the following tables, based on the census classification, give the salient figures for the years 1934, 1935 and 1936 : There are several obvious points to notice in these tables, but the most conspicuous, perhaps, are the increasing use of electrics for goods, and the fairly rapid expansion of motor-vehicle employment in the agricultural industry. 01 the 444,622 commercial goods vehicles in service at the end of the most recent census year, 129,217 were of 1 ton or less unladen weight, whilst 27:3,433 were between I ton and 3 tons.
Better Sales of Vehicles Under 3 Tons The remainder, 41,972, were over 3 tons and included '80 of an unladen weight of 10 tons or over. Compared with the 1935 census, the figures reveal an increase of 23,961 vehicles of a weight unladen less than 3 tons and a decrease of 955 in those of higher weight.
The number of new commercial goods vehicles brought into service last year (75,848) was 8,594 more than in 1935; 52,842 old vehicles were withdrawn or suspended. The net increase in the number in service was, therefore, 23,006, compared with an increase of 18,572 in 1935.
The distribution of commercial goods vehicles, as between public carriers, on the one hand, and private traders, on the other, is a subject upon which, at this point, a word or two might usefully be said. We turn for the facts to another return published by the Ministry of Transport, dealing with statistics relating to goods vehicles authorized under carriers' licences at April 30, 1936. At that date the number of licence holders was as follows : A, 27,755; B, 34,119; C. 161,221; total, 213,095. Public carriers under A licences constitute about 12.4 per cent, of the total number of licensees and control over 21 per cent, of the total vehicles authorized. Roughly, two-fifths of the A-licence vehicles are held by operators of fewer than five vehicles each, nearly a third by operators of five to 25 vehicles each, and just over a quarter by operators of More than 25 units. The railways and the road-transport undertakings controlled by them own about 13 per cent, of all A-licence vehicles.
Limited carriers under B licences constitute approxi, mately 15.3 per cent. of all licensees and control about 11 per cent, of the authorized vehicles. Ancillary users (C-licensees) comprise 72.3 per cent. of all operators and own nearly 68 per cent, of the vehicles.
As might be expected; most of the_ licence holders (17.47 per cent.) operate from the Metropolitan Area. The North-Western Area comes next with 13.80 per cent. of licence holders, and other areas follow in this order : Yorkshire, 10.40 per cent.; West Midland, 9.09 per cent. ; Western, 9.08 per cent. ; East Midland, 8.35 per cent. ; South-Eastern, 7.85 per cent. ; Eastern, 5.92 per gent. ; Southern Scotland, 5.90 per cent. ; Northern, 4.57 per cent.,; South Wales, 4.34 per cent. ; and Northern Scotland, 3.23 per cent.
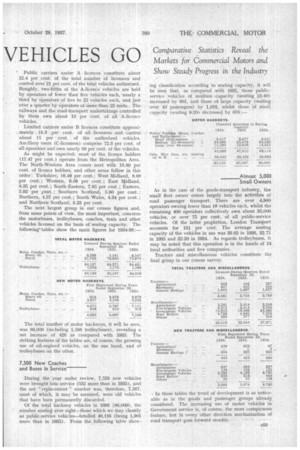
The next largest group in our census figures and, from some points of view, the most important, concerns the motorbuses, trolleybuses, coaches, taxis and other vehicles licensed on the basis of seating capacity. The following' tables show the main figures for 1934-36:
The total nuniber of motor hackneys, it will be seen, was .86,009 (including 1,588 trolleybuses), revealing a net increase of 426 as compared with 1935. The striking features of the tables are, of course, the growing use of oil-engined vehicles, on the one hand, and of trolleybuses on the other.
7,500 New Coaches and Buses In Service
During the year under review, 7,529 new vehicles were brought into service (532 more than in 1935), and the net "replacement" number was, therefore, 7,567, most of which, it may be assumed, were old vehicles that have been permanently discarded.
Of the total hackney vehicles in 1936 (86,009), the number seating over eight-those which we may classify as public-service vehicles-totalled 49,116 (being 1,901 more than in 1935). From the following table show
ing classification according to seating capacity, it will be seen that, as compared with 1935, those publicservice vehieles of medium 'capacity (seating 21-40) .increased by 601, and those of large capacity. (seating over 40 passengers) by 1,976, whilst those of small capacity (seating 9-20) decreased by 676 :
As in the case of the goods-transport industry, the small fleet owner enters largely into the activities of road passenger transport. There are over 4,900 operators owning fewer than 10 vehicles each, whilst the remaining 400 operators collectively own about 35,000 vehicles, or over 75 per cent. of all public-service vehicles. Of the latter proportion, London Transport accounts for 134 per cent. The average seating capacity of the vehicles in use was 33.62 in 1936, 32.71 in 1935 and 32.20 in 1934. As regards trolleybuses, it may be noted that this operation is in the hands of 24 local authorities and five companies.
Tractors and miscellaneous vehicles constitute the final group in our census survey.
In these tables the trend of development is as noticeable as in the goods and passenger groups already considered. The increasing use of motor vehicles in Government service is, of course, the most conspicuous feature, but in every other direction mechanization of road transport-goes forward steadily.