 1
1 2
2 3
3 4
4 5
5 6
6 7
7 8
8 9
9 10
10 11
11 12
12 13
13 14
14 15
15 16
16 17
17 18
18 19
19 20
20 21
21 22
22 23
23 24
24 25
25 26
26 27
27 28
28 29
29 30
30 31
31 32
32 33
33 34
34 35
35 36
36 37
37 38
38 39
39 40
40 41
41 42
42 43
43 44
44 45
45 46
46 47
47 48
48 49
49 50
50 51
51 52
52 53
53 54
54 55
55 56
56 57
57 58
58 59
59 60
60 61
61 62
62 63
63 64
64 65
65 66
66 67
67 68
68 69
69 70
70 71
71 72
72 73
73 74
74 75
75 76
76 77
77 78
78 79
79 80
80 81
81 82
82 83
83 84
84 85
85 86
86 87
87 88
88 89
89 90
90 91
91 92
92 93
93 94
94 95
95 96
96 97
97 98
98 99
99 100
100 101
101 102
102 103
103 104
104 105
105 106
106 107
107 108
108 109
109 110
110 111
111 112
112 113
113 114
114 115
115 116
116 117
117 118
118 119
119 120
120 121
121 122
122 123
123 124
124 125
125 126
126 127
127 128
128 129
129 130
130 131
131 132
132 133
133 134
134 135
135 136
136 137
137 138
138 139
139 140
140 141
141 142
142 143
143 144
144 145
145 146
146 147
147 148
148 149
149 150
150 151
151 152
152 153
153 154
154 155
155 156
156 157
157 158
158 159
159 160
160 161
161 162
162 163
163 164
164 The Transition Statistically from Tram to Bus Portrayed 0 NCE
Page 84
Page 85
If you've noticed an error in this article please click here to report it so we can fix it.
again we present our annual summary of municipal passenger transport undertakings in their three categories—motorbuses, trolleybuses and tramcars—and once again we are faced with features that have become commonplace, that is to say, that the abandonment of tramways is proceeding rapidly ; the introduction of trolleybus systems is being speeded up ; and the development of motorbus services is con
tinuously progressive. The very fact, however, that these features have become commonplace leaves us in some danger of overlooking their significance, and a careful study of the accompanying tables is, therefore, worth while.
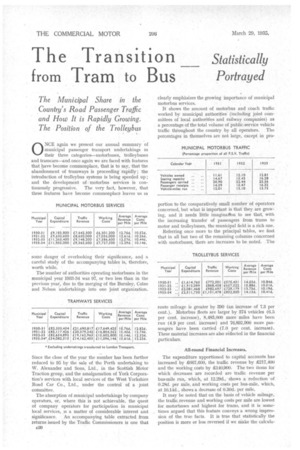
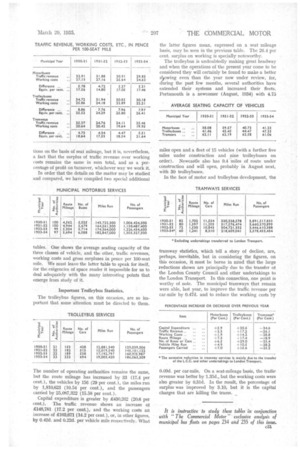
The number of authorities operating motorbuses in the municipal year 1933-34 was 97, or two less than in the previous year, due to the merging of the Burnley, Come and Nelson Undertakings into one joint organization.
Since the close of the year the number has been further reduced to 95 by the sale of the Perth undertaking to W. Alexander and Sons, Ltd., in the Scottish Motor Traction group, and the amalgamation of York Corporation's services with local services of the West Yorkshire Road Car Co., Ltd., under the control of a joint committee.
The absorption of municipal undertakings by company operators, or, where this is not achievable, the quest of company operators for participation in municipal local services, is a matter of considerable interest and significance. An accompanying table extracted from returns issued by the Traffic Commissioners is one that c30 clearly emphasizes the growing importance of municipal motorbus services.
It shows the amount of motorbus and coach traffic worked by municipal authorities (including joint committees of local authorities and railway companies) as a percentage of the total volume of public-service vehicle traffic throughout the country by all operators. The percentages in themselves are not large, except in pro portion to the comparatively small number of operators concerned, but what is important is that they are growing, and it needs little imagination to see that, with the increasing transfer of passengers from trams to motor and trolleybuses, the municipal field is a rich one.
Referring once more to the principal tables, we find that in all but two of the remaining columns concerned with motorbuses, there are increases to be noted. The
route mileage is greater by 390 (an increase of 7.3 per cent.). Motorbus fleets are larger by 374 vehicles (6.5 per cent. increase), 8,483,000 more miles have been run (4.9 per cent. increase) and 70,892,900 more passengers have been carried (7.0. per cent. increase). These material increases are also reflected in the financial particulars.
All-round Financial Increases.
The expenditure apportioned to capital accounts has increased by £007,600, the traffic revenue by 2217,400 and the working costs by £140,900. The two items for which decreases are recorded are traffic revenue per bus-mile run, which, at 12.29d., shows a reduction • of 0.28d. per mile, and working costs per bus-mile, which, at 10.14d., shows a decrease of 0.30d. per mile.
It may be noted that on the basis of vehicle mileage, the traffic revenue and working costs per mile are lowest for motorbuses and highest for trams, and it is sometimes argued that this feature conveys a wrong impression of the true facts. It is true that statistically the position is more or less reversed if we make the cakula tions on the basis of seat mileage, but it is, nevertheless, a fact that the surplus of traffic revenue over working costs remains the same in sum total, and as a percentage of profit on turnover, whichever way we work it.
In order that the details on the matter may be studied and compared, we have compiled two special additional tables. One shows the average seating capacity of the three classes of vehicle, and the other, traffic revenues, working costs and gross surpluses in pence per 100-seat mile, We must leave the latter table to speak for itself, for the exigencies of space render it impossible for us to deal adequately with the many interesting points that emerge from study of it.
Important Trolleybus Statistics.
The trolleybus figures, on this occasion, are so important that some attention must be directed to them.
The number of operating authorities remains the same, but the route mileage has increased by 33 (17.4 per cent.), the vehicles by 156 (29 per cent.), the miles run by 1,810,623 (10.54 per cent.), and the passengers carried by 25,087,322 (15.58 per cent.).
Capital expenditure is greater by £430,262 (20.6 per cent.). The traffic revenue shows an increase of 2148,781 (17.2 per cent.), and the working costs an increase of 2103,671 (14.2 per cent.), or, in other figures, by 0.42d. and 0.22d. per vehicle mile respectively. What the latter figures mean, expressed on a seat mileage basis, may be seen in the previous table. The 26.4 per cent. surplus on working is specially noteworthy.
The trolleybus is undoubtedly making great headway and when the operations of the present year come to be considered they will certainly be found to make a better slpwing even than the year now under review, for, during the past few months, several authorities have extended their systems and increased their fleets. Portsmouth is a newcomer (August, 1934) with 4.75
miles open and a fleet of 15 vehicles (with a further five miles under construction and nine trolley-buses on order). Newcastle also has 9.4 miles of route under construction and will open, probably in August next, with 30 trolleybuses.
In the face of motor and trolleybus development, the
tramway statistics, which tell a story of decline, are, perhaps, inevitable, but in considering the figures, on this occasion, it must be borne in mind that the large reductions shown are principally due to the transfer of the London County Council and other undertakings to the London Transport. In this connection, one point is worthy of note. The municipal tramways that remain were able, last year, to improve the traffic revenue per car-mile by 0.47d. and to reduce the working costs by 0.09d. per car-mile. On a seat-mileage basis, the traffic. revenue was better by 1.35d., but the working costs were also greater by 0.31d. In the result, the percentage of surplus was improved by 3.10, but it is the capital charges that are killing the trams.
It is instructive to study these tables in conjunction with "The Commercial Motor" exclusive analysis of municipal bus fleets on pages 234 and 235 of this issue.