


COSTS IN OCTOBER 940, AND COSTS TO-DAY
Page 24
Page 25
If you've noticed an error in this article please click here to report it so we can fix it.
Solving the Problems of the Carrier
A Fu7ther Article Showing the Haulier the Procedure Which He Must Adopt if He is Going to be Able to Lay Figures Before the Regional Transport Commissioner in Support of a Claim That His Charges To-clay Should Be More Than 71 per cent. in Excess
of His Charges in October, x94o
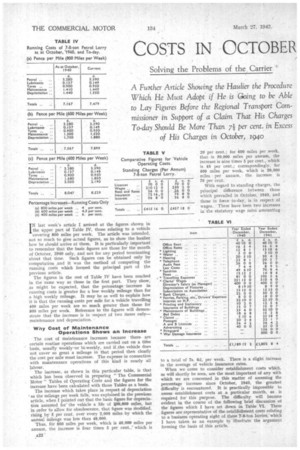
IN last week's article I arrived at the figures shown in the upper part of Table IV, those relating to a vehicle covering 800 miles per week_ The article was intended, not so much to give actual figures, as to shaw the haulier how he should arrive at them. It is particularly important to remember that the basic figures are those for the month of October, 1940 only, and not for any period terminating about that time. Such figures can be obtained only by computation and it was the method of computing the running costs which formed the principal part of the previous article.
The figures in the rest of Table IV have been reached in the same way as these in the first part. They show, as might be expected, that the percentage increase in running costs is greater for a low weekly mileage than for a high weekly mileage_ It may be as well to explain how it is that the running costs per mile for a vehicle travelling 400 miles per week are so much greater than those for 800 miles per week. Reference to the figures will demonstrate that the increase is in respect of two items onlymaintenance and depreciation.
Why Cost of Maintenance Operations Shows an Increase The cost of maintenance increases because thereare certain routine operations which are carried out on a time basis, usually weekly-or hi-weekly, and if .the vehicle does not cover so great a mileage in that period then clearly the cost per mile must increase. The expense in connection with maintenance operations of this kind is nearly all labour.
The increase, as shown in this particular table, is that which has been observed in preparing "The Commercial Motor " Tables of Operating Costs and the figures for the increase have been calculated with those Tables as a basis. The increase which takes place in respect of depreciation as the mileage per week falls, was explained in the previous article, when I pointed out that the basic figure for depreciation assumed for thevehicle a he of 200,000 miles, but in order to allow for obsolescence, that figure was modified, rising by 5 per cent. over every 2,000 miles by which the annual mileage was less than 48,000.
Thus, far 800 miles per week, which is 40,000 miles per annum, the increase is four times 5 per cent,which is
20 per cent.; for 600 miles per week, that is 30,000 miles per annum, the increase is nine times 5 per cent., which is 45 per cent.; correspondingly, for 400 miles per week, which is 20,000 miles per annum, the increase is 70 per cent.
With regard to standing charges, the principal difference between those which prevailed in October, 1940, and those in farce to-day, is in respect of wages. -There have been two increases in the statutory wage rates amounting to a total of 7s. 6d. per week. There is a slight increase in the average of vehicle insurance rates_
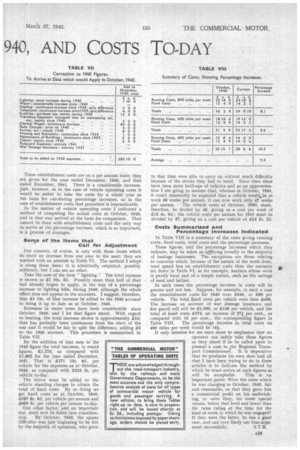
When we come to consider establishment costs which, as will shortly he seen, are the most important of any with which we are concerned in this matter of assessing the percentage increase since October, 1940, the greatest difficulty is encountered. It is practically impossible to assess establishment costs at a particular month, as is required for this purpose. The difficulty will become evident in the course of the following brief discussion bf the figures Which I have set down in Table VI. These figures arerepresentative of the establishment costs relating to a business operating eight of these 7-8-ton lorries, which I have taken as an example to illustrate the argument forming the basis of this article. These establishment costs are on a per annum basis; they are given for the year ended December, 1940, and that ended December, 1941. There is a considerable, increase. Just, however, as in the case of vehicle operating costs it would be unfair to take the costs for a whole year as the basis for calculating percentage increases, so in the case of establishment costs that procedure is impracticable. In the matter of vehicle operating costs' I indicated a method of computing the actual costs at October, 1940, and in that way arrived at the basis for comparison. That cannot be done with establishment costs and the only way to arrive at the percentage increase, which is so important, is a process of averages.
Sone of the Items that Call for Adjustment
Our concern, of course, is only with those items which do show an increase from one year to the next; they are marked with an asterisk in Table VI. The method I adopt is along these lines; it is admittedly empirical, possibly arbitrary, but I can see no other.
Take the case of the item "lighting.'.' The total increase is shown as £1 10s. 5d. Possibly more than half of that had already begun to apply, in the way of a percentage increase to lighting bills, during 1940, although the whole effect does not appear in the accounts. I suggest, therefore, that £1 10s. of that increase be added to the 1940 account to bring it up to date as at October, 1940.
Increases in water rates have been considerable since October, 1940, and I let that figure stand. , With regard to heating, the total increase shown is approximately 210; that has probably been continuous from the start of the war and it would be fair to split the difference, adding £5 to the 1940 account. This procedure is summarized in
Table VII. '
By the addition of that sum to the 1940 figure the total becomes, in round figures, £1,273, as compared with 21,802 for the year ended December, 1941. That is £171 12s. 6d. per vehicle for the expenses as at October, 1940, as compared with £225 5s. per vehicle to-day.
The above must be added to the vehicle standing charges to obtain the total of fixed costs. By so doing we get fixed costs as at October, 1940, £587 8s. 6d, per vehicle per annum and £663 3s. per vehicle per annum to-day.
One other factor, and an important one, must now be taken into considera tion. By October, 1940, the spares difficulty was just beginning to be felt by the majority of operators, who prior to that time were able to carry on without much difficulty because of the stocks they had in hand. Since then there have been more hold-ups of vehicles and as an approximation I am going to assume that, whereas in October, 1940, it could reasonably be expected that a vehicle would.,be at work 48 weeks per annum, it can now work only 47 weeks per annum. The vehicle costs at October, 1940, must, therefore, be divded by 48, giving us a cost per week of 212 4s. 9d.; the vehicle costs per annum for 1941 must be divided by 47, giving us a cost per vehicle of £14 2s. 2d.
Costs Summarized and Percentage Increases Indicated
In Table VIII is a summary of the costs giving running" costs, fixed costs, total costs and the percentage increases.
These figures, and the percentage increases which they indicate, may be taken as applying broadly to the majority of haulage businesses. The exceptions are those relating to concerns which, because of the nature of the work done, need spend less on establighment costs than the amounts set down in Table VI, as for example, hauliers whose work is purely local and of a simple nature, such as the cartage of sand and ballast.
In such cases the percentage increase in costs will be greater and not less. Suppose, for example, in such a case the establishment costs for 1940 were £640, or £80 per vehicle. The total fixed costs per vehicle were then £496. The increase on account of war damage insurance and fire guard will still be 21,090, or £136 per vehicle, and the total of fixed costs £574, an increase of 27i per cent., as compared with 15 per cent., the corresponding figure in Table VIII. The percentage increase in total costs on 400 miles per week would be 14i.
It only remains fur me once more to emphasize that no operator can safely take these figures as they stand if he be called upon to present a case to he Regional Transport Commissioner. It is imperative that he produces his own data And all that I have been trying to do in these articles is to indicate -the method by which he must arrive at such figures as will be acceptable. This is an important point: Were the rates which he was charging in October, 1940, fair and reasonable, so that they gave him a commercial profit on his undertaking, or were they, for some special reason, below that level and lower than the rates ruling at the time for the kind of work in which he was engaged' If they were the latter, he has a good case, and can very likely use that argu
ment successfully. S.T.R.