


FLEET PLANING
Page 40
If you've noticed an error in this article please click here to report it so we can fix it.
and, of course, accident costs. The second aspect is traffic organization, covering vehicle routeing to avoid traffic hold-ups and delivery delays, vehicle utilization and the availability of vehicles.
It has been proved beyond doubt that hard and aggressive driving pays a considerable part in inflating the costs of vehicle operation. Fierce acceleration, sustained and 'excessive high speeds and hard braking cause an excessive amount of fuel to be used, unnecessarily heavy wear on brake linings and tyres, and are detrimental to the transmission system of the vehicle. In general, more frequent maintenance schedules are then required, leading in the long run to the premature retirement of the vehicle from service. The overall long-term effects of this, in addition to the immediate direct costs, can be quite astounding. If vehicles need more frequent maintenance than originally planned, firstly additional maintenance staff, premises and facilities may be required, and secondly more vehicles and therefore more tax and insurance and garage space may be needed to do the same amount of work. To provide such extras, means that additional capital has to be found and this in turn costs extra money in the way of interest charges, so that not only the vehicle running costs increase but the standing costs and establishment costs as well.
Fleet activities
Organizationally, the information obtainable is valuable because it enables an overall view to be taken of the fleet activities in terms of utilization (ie the percentage of loaded running time to total operating time) of individual vehicles and of the fleet as a whole.
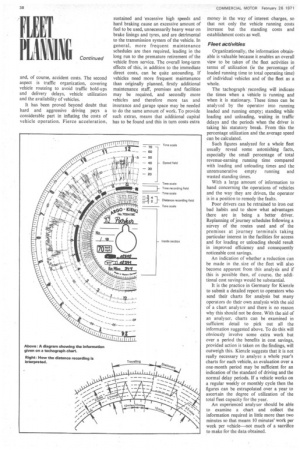
The tachograph recording will indicate the times when a vehicle is running and when it is stationary. These times can be analysed by the operator into running loaded and running empty; standing while loading and unloading, waiting in traffic delays and the periods when the driver is taking his statutory break. From this the percentage utilization and the.average speed can be calculated.
Such figures analyzed for a whole fleet usually reveal some astonishing facts, especially the small percentage of total revenue-earning running time compared with loading and unloading times and the unremunerative empty running and wasted standing times.
With a large amount of information to hand concerning the operations of vehicles and the way they are driven, the operator is in a position to remedy the faults.
Poor drivers can be retrained to iron out bad habits and to show what advantages there are in being a better driver. Replanning of journey schedules following a survey of the routes used and of the premises at journey terminals taking particular interest in the facilities for access and for loading or unloading should result in improved efficiency and consequently noticeable cost savings.
An indication of whether a reduction can be made in the. size of the fleet will also become apparent from this analysis and if this is possible then, of course, the additional cost savings would be substantial.
It is the practice in Germany for Kienzle to submit a detailed report to operators who send their charts for analysis but many operators do their own analysis with the aid of a chart analyser and there is no reason why this should not be done. With the aid of an analyser, charts •can be examined in sufficient detail to pick out all the information suggested above. To do this will obviously involve some extra work but over a period the benefits in cost savings, provided action is taken on the findings, will outweigh this. Kienzle suggests that it is not really necessary to analyse a whole year's• charts for each vehicle, as evaluation over a one-month period may be sufficient for an indication of the standard of driving and the normal delay periods. If a vehicle works on a regular weekly or monthly cycle then the figures can be extrapolated over a year to ascertain the degree of utilization of the total fleet capacity for the year.
An experienced analyser should be able to examine a chart and collect the information required in little more than two minutes so that means 10 minutes' work per week per vehicle—not much of a sacrifice to make for the data obtained.