


WHERE THE HAULAGE FLEETS ARE LOCATED
Page 12
If you've noticed an error in this article please click here to report it so we can fix it.
Extracts from the Ministry of Transport's latest survey
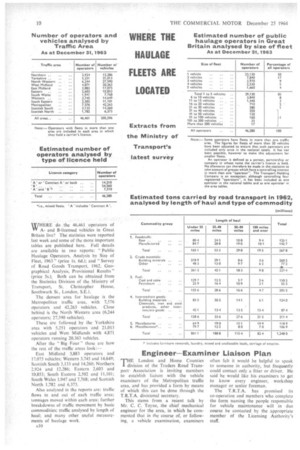
WHERE do.. the 46,461 operators of VI' Aand B-licensed vehicles in Great Britain live? The statistics were reported last week and some of the more important tables are published here. Full details are available in two reports: "Public Haulage_ Operators, Analysis by Size of Fleet, 1963" (price Is. 6d.); and "Survey of Road Goods Transport, 1962, Geographical Analysis, Provisional Results" (price 5s.). Both can be obtained from the Statistics Division of the Ministry of Transport, St. Christopher House, Southwark St., London, S.E.1.
The densest area for haulage is the Metropolitan traffic area, with 7,576 Operators and 42,265 vehicles. Close behind is the North Western area (6.244 operators; 27,590 vehicles).
These are followed by the Yorkshire area with 5,251 operators and 21,013 vehicles and West Midlands with 4,371 operators running 20,363 vehicles.
After the "Big Four" these are how the rest of the traffic areas look: East Midland 3,883 operators and 17,075 vehicles; Western 3,745 and 14,649; Scottish South 3,133 and 14.260; Northern 2,924 and 12,286; Eastern 2,603 and 10,853; South Eastern 2,502 and 11,101; South Wales 1,947 and 7368; and Scottish North 1,782 and 6,373.
Also analysed in the reports are: traffic flows in and out of each traffic area; tonnages moved within each area; further breakdowns of traffic movement by basic commodities: traffic analysed by length of haul; and many other useful measurements of haulage work.