


costing for maximum profit
Page 60
Page 61
If you've noticed an error in this article please click here to report it so we can fix it.
A SPECIAL SERIES BY R. P. C. BLOCK
12. Driver/vehicle performance and operating results
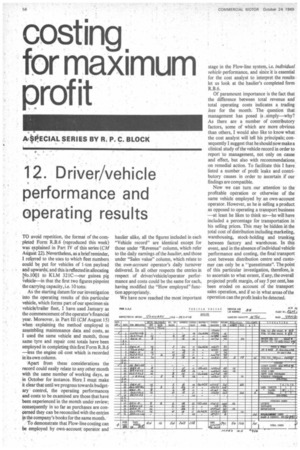
TO avoid repetition, the format of the completed Form R.B.6 (reproduced this week) was explained in Part IV of this series (CM August 22). Nevertheless, as a brief reminder, I referred to the uses to which fleet numbers could be put for vehicles of 1-ton payload and upwards, and this is reflected in allocating n.100.1 to KLM 321C—our guinea pig vehicle—in that the first two figures pinpoint the carrying capacity, i.e. 10 tons.
As the starting datum for our investigation into the operating results of this particular vehicle, which forms part of our specimen six vehicle/trailer fleet, I have used January as the commencement of the operator's financial year. Moreover, in Part III (CM August 15) when explaining the method employed in assembling maintenance data and costs, as I used the same vehicle and month, those same tyre and repair cost totals have been employed in completing this first Form R.B4 —less the engine oil cost which is recorded in its own column.
Apart from these considerations the record could easily relate to any other month with the same number of working days, as in October for instance. Here I must make it clear that until we progress towards budgetary control, the operating performances and costs to be examined are those that have been experienced in the month under review, consequently in so far as purchases are concerned they can be reconciled with the entries in the company's books for the same month.
To demonstrate that Flow-line costing can be employed by own-account operator and haulier alike, all the figures included in each "Vehicle record" are identical except for those under "Revenue" column, which refer to the daily earnings of the haulier, and those under "Sales value" column, which relate to the own-account operator's daily turnover delivered. In all other respects the entries in respect of driver/vehicle/operator performance and costs could be the same for each, having modified the "How employed" function appropriately.
We have now reached the most important stage in the Flow-line system, i.e. individual vehicle performance, and sine it is essential for the cost analyst to interpret the results let us look at the haulier's completed form R.B.6.
Of paramount importance is the fact that the difference between total revenue and total operating costs indicates a trading loss for the month. The question that management has posed is simply—why? As there are a number of contributory factors, some of which are more obvious than others, I would also like to know what the cost analyst will 'tell his principals; consequently I suggest that he should now make a clinical study of the vehicle record in order to report to management, not only on cause and effect, but also with recommendations on remedial action. To facilitate this I have listed a number of profit leaks and contributory causes in order to ascertain if our findings are compatible.
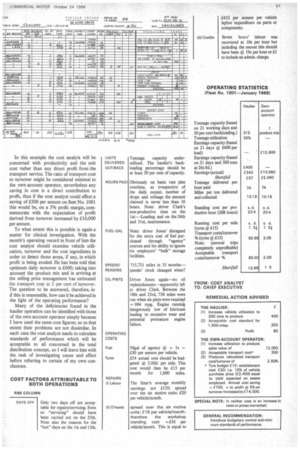
Now we can turn our attention to the profitable operation or otherwise of the same vehicle employed by an own-account operator. However, as he is selling a product as opposed to operating a transport business —at least he hies to think so—he will have included a percentage for transportation in his selling prices. This may be hidden ill the total cost of distribution including marketing, warehousing, stock-holding and trunking between factory and warehouse. In this event, and in the absence of individual vehicle performance and costing, the final transport cost between distribution centre and customer can only be a "guesstimate". The point of this particular investigation, therefore, is to ascertain to what extent, if any, the overall projected profit margin, of say 5 per cent, has been eroded on account of the transport sales operation, and if so in what areas of the operation can the profit leaks be detected. In this example the cost analyst will be concerned with productivity and the unit cost rather than any direct profit from the transport service. The ratio of transport cost to turnover might be considered minimal to the own-account operator, nevertheless any saving in cost is a direct contribution to profit, thus if the cost analyst could effect a saving of £500 per annum on fleet No. 1001 this would be, on a 5% profit margin, commensurate with the expectation of profit derived from turnover increased by £10,000 per annum.
To what extent this is possible is again a matter for clinical investigation. With the month's operating record in front of him the cost analyst should examine vehicle utilization, turnover and the cost ingredients in order to detect those areas, if any, in which profit is being eroded. He has been told that optimum daily turnover is £600; taking into account the product mix and in arriving at the selling price management has estimated the transport cost at 2 per cent of turnover. The question to be answered, therefore, is: if this is reasonable, how can it be achieved in the light of the operating performance?
Many of the deficiencies found in the haulier operation can be identified with those of the own-account operator simply because I have used the same cost figures; so to that extent their problems are not dissimilar. In each' case the cost analyst needs to calculate standards of performance which will be acceptable to all concerned in the total distribution concept, so will leave him with the task of investigating cause and effect before referring to certain of my own Conclusions.