PROGRESS OF PASSENGER TRANSPORT.
Page 20

Page 21

If you've noticed an error in this article please click here to report it so we can fix it.
A Set of Most Interesting and Informative Figures Showing the Growth in the Past Eight Years of the Number of Undertakings, their Capital and their Fleets.
-WHNe°lstth
the e xte n tan and the social and industrialim:tancooftbeotorbusand
coach services now in operation in all parts of the country, it is interesting, and not uninstruutive, to reflect that the industry is one which bears a history of something leas than 25 years.
If we disregard the earliest attempts to place mechanically propelled buses upon the public roads, and confine our attention to what may be described as the modern motor passenger vehicle, we go back no farther than to 1904 to find the first motorbuses plying for hire on regular routes. In that year London, as an example, was provided with a service of 20 motorbuses ; to-day the omnibuses licensed in the Metropolis number approximately 5,700.
The licence motor taxation figures issued by the Ministry of Transport might well furnish, indeed, an epitome of the progress in passenger mechanical transport throughout the country. We may learn from them the numbers of "motor hackneys" in respect of which licences were issued during the past four years. The 'numbers are approximately as follow:
Year. Vale! es. Year. Vehicles. Year. Vehicles. Year. Vehicles.
1921 ... '76,001 1922 ... 77,800. 1923 ... 86,000 1924 .. 94,200.
The bare figures, however, while indicating the extent and the rapidity of the growth in the employment of the public service vehicle, suffer from the fault which attaches to all figures, of saying too little! The term " motor hackneys" em braces, of cars. The largest single class is undoubtedly formed' of motOecabs (London has over 8,000), with motor omnibuses, motor coaches and other private-hire cars next in order respectively.. An official analysis of the licence figures showing the number of each class of vehicle and the proprietors among whom they are distributed would be illuminating and of considerable interest.
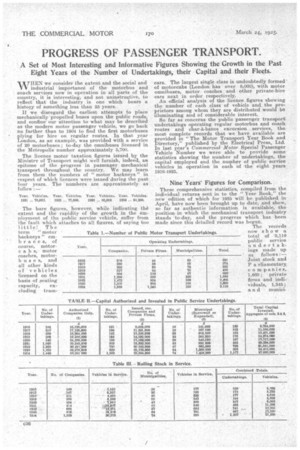
So far as concerns the public passenger transport undertakings operating regular motorbus and coach routes and char-h-bancs excursion services, the most complete records that we have available are provided in "The Motor Transport Year Book and Directory," published by the Electrical Press, Ltd. In last year's Commercial Motor Special Passenger Vehicle Number we were able to provide some statistics showing the number of undertakings, the capital employed and the number of public service vehicles in operation in each of the eight years 1916-1923.
Nine' Years' Figures for Comparison.
These comprehensive statistics, compiled from the individual returns sent in to the "Year Book," the new edition of whieh for 1925 will be published in April, have now been brought up to date, and show, so far as authentic information is available, the position in which the mechanical transport industry stands to-day, and the progress which has been made since this detailed record was begun. palities, including those applying for powers in the present Parliamentary session, 105. These figures, and particularly those for private firms, must be regarded as minimum figures, owing to the practical impossibility of obtaining particulars from all oneman concerns and small partnerships. Nevertheless, they demonstrate very clearly, in the light of previous records, the steadily growing dependence upon motor vehicles providing public motor services.
The data provided in the individual returns of these undertakings are of a valuable character, and comprise detailed particulars of the motor fleets, the nature of the services undertaken, the directors, proprietors and other officials of the undertaking, the number of passengers carried, mileage run, capital employed, results of operation, dividends paid, etc. ; but, as might be expected, complete information on all these points is not obtainable for all the undertakings recorded\ The totals shown in the accompanying statistical tables are based upon the definite information available, the number of concerns included in the calculations being in each case stated.
Capital Authorized and Issued.'
Analysis of the data relating tO finance reveals the fact that 1,577 transport undertakings have a total of £27,063,000 invested in the provision of public motor service facilities. The figure includes municipal capital actually expended the capital expenditure of some private firms, and the issued share and debentree capital of joint stock and Parliamentary companies. In the case of joint stock and Parliamentary companies largely interested in other forms of transport, an amount proportionate to their interest, in motor transport only has been included. It will be observed that the increase in the capital invested over the amount recorded last year amounts to 22,648,000, and this increase is accompanied by an addition of 584 undertakings.
Motor Vehicles in Public Services.
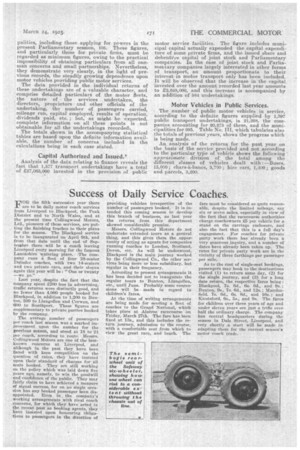
. The number of public motor vehicles in service, according to the definite figures supplied by 1,397 public transport undertakings, is 21,268, the companies accounting for 20,273 of these, and the muni. mpalities for 995. Table No. HI, which tabulates also the totals of previous years, shows the progress which is being made. An analysis of the returns for the past year on the basis of the service provided and not according to the particular tyrie of vehicle shows the following approdemate division of the total among the different classes of vehicles dealt with :—Buses, 13,000; chars4-bancs, 3,790 ; hire cars, 1,400; goods and parcels, 3,200.


