


Maintaining Group Efficiency in transport
Page 49
If you've noticed an error in this article please click here to report it so we can fix it.
PREVIOUS articles of mine have dealt with individual costs and efficiency, and methods. whereby units of similar class, although of diverse makes, can be compared with their neighbours. Little; however, has been said about " collective economy' and, no doubt, transport operators will be interested in a discussion of this aspect of fleet supervision.
The " efficiency " of a fleet is undoubtedly the certainty of effecting deliveries without delay and to the customer's entire satisfaction, whilst " economy " is the certainty that this traffic has been handled in the cheapest manner. Having established my meaning of the terms " efficiencY" and "economy," it will be informative to introduce here the operating data of a group of vehicles :
The first step in this investigation is to consider the total tonnage and the total active .service hours of the fleet, in conjunction with average statistics for all those vehicles' which have a life mileage of less than 50,000 accredited to them. This figure is, of course, arbitrary and may bd. varied to meet individual conditions, but I do not recommend that it should be exceeded. It will also be noted that data relative to mileage are not otherwise to be considered, because of the difficulty of assessing a value to mileage run and tonnage delivered, whereas an easier grasp is obtainable from an examination of tonnage carried and active service hours.
Interesting Comparative Data.
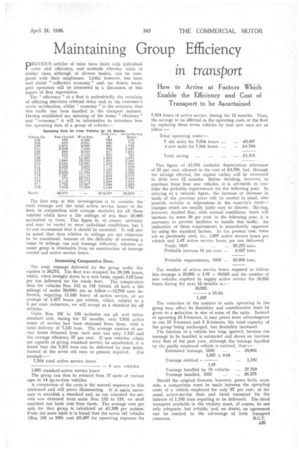
The total tonnage delivered by the group under dis cussion is 26,275. The fleet was occupied for 28,249 hours, which, when brought down to a unit basis, equals 1.07 hour per ton delivered for the whole fleet. The comparative data for vehicles Nos. 112 to 118 (which all have a life mileage of under 50,000) are as follow :-12,760 tons delivered, requiring 13,840 hours of active service, or an average of 1,977 hours per vehicle, which, subject to a 5 per cent. reduction, we will accept as a standard for all vehicles.
Units Nos. 102 to 108 inclusive are all Well below standard and, during the 12 months, only 7,934 active hours of service had been obtained from them, with a total delivery of 7,233 tons. The average number of service hours obtained from each unit was only 1,133 and the average efficiency 57 per cent. If new vehicles, which are capable of giving standard service, be substituted, it is found that the 7,233 tons can be delivered by . four units, instead of the seven old ones at present required. For example: 7,931 total active service hours 4 new vehicles, 1,997 standard active service hours The group can thus he reduced from 17 units of various ages to 14 up-to-date vehicles.
A comparison of the costs is the natural sequence to this disclosure and will prove illuminating. It is again necessary to establish a standard and, as our standard for service was obtained from units Nos. 112 to 118, we shall establish our basic cost from them. The average cost per unit for that group is calculated at £1,199 per annum. From the same table it is fciund that the seven old vehicles (Nos. 102 to 108) cost g6,497 for operating expenses for This figure of £1,701 excludes depreciation allowance of 25 per cent. allowed in the cost of £4,796, but, through the savings effected, the capital outlay will be recovered in little over 12 months. Before deciding, however, to purchase these four new vehicles, it is advisable to consider the probable requirements for the following year. In arriving at a suitable figure, the increase or decrease in trade of the previousyears will he carried in mind,, also possible revivals or depressions in the country's tradechanges which are usually fairly easy to discern. Having, however, decided that, with normal conditions, trade will increase by some 10, per cent, in the following year, it is necessary to provide facilities to handle this traffic. An indication of these requirements is immediately apparent by using the standard factors. In the present case, these are as previously used, 1,997 active service hours per vehicle and 1.07 active service hours per ton delivered.
Trade, 1935 ... 26,275 tons.
Probable increase 10 per cent. ... 2,627 tons.
Probable requirements, 1936 ... 28,902 tons.
The number of active service hours required to deliver this tonnage is 28,002 X 1.07 30,925 and the number of new vehicles required to supply active service for 30,925 hours during the next 12 months is 30,925 The reduction of the number of units operating in the group may. affect its flexibility and consideration must be given to a seduction in size of some of the units. Instead of operating 15 5-tonners, it may prove more advantageous to run 13 5-tontiers and 5 2-tonners, the total capacity of the groupTheing unchanged, but flexibility increased.
The fraction of a vehicle has been ignored, because the tonnage to be handled is estimated and shows an increase over that of the past year, although the tonnage handled by the partly employed vehicle is omitted, thus : Estimated tonnage, 1936 ... 28,902 1,997 x 0.64 Tonnage omitted ... 1,182 Tonnage handled by 15 vehicles ... 27,720 Tonnage bandied, 1935 Should the original forecast, however, prove fairly accurate, a comparison must be made between the operating costs of a vehicle employed for only 57 per cent. of the usual active-service time and hired transport for the balance of 1,182 tons requiring to be delivered. The hired transport available in the vicinity must, of course, be not only adequate, but reliable, arid, no 'doubt, an agreement. can be reached to the advantage of 'both tran,sport ccincerns. R.G.T.