 1
1 2
2 3
3 4
4 5
5 6
6 7
7 8
8 9
9 10
10 11
11 12
12 13
13 14
14 15
15 16
16 17
17 18
18 19
19 20
20 21
21 22
22 23
23 24
24 25
25 26
26 27
27 28
28 29
29 30
30 31
31 32
32 33
33 34
34 35
35 36
36 37
37 38
38 39
39 40
40 41
41 42
42 43
43 44
44 45
45 46
46 47
47 48
48 49
49 50
50 51
51 52
52 53
53 54
54 55
55 56
56 57
57 58
58 59
59 60
60 61
61 62
62 63
63 64
64 65
65 66
66 67
67 68
68 69
69 70
70 71
71 72
72 73
73 74
74 75
75 76
76 77
77 78
78 79
79 80
80 81
81 82
82 83
83 84
84 85
85 86
86 87
87 88
88 89
89 90
90 91
91 92
92 93
93 94
94 95
95 96
96 97
97 98
98 99
99 100
100 101
101 102
102 103
103 104
104 105
105 106
106 107
107 108
108 109
109 110
110 111
111 112
112 113
113 114
114 115
115 116
116 117
117 118
118 119
119 120
120 121
121 122
122 123
123 124
124 125
125 126
126 127
127 128
128 129
129 130
130 131
131 132
132 133
133 134
134 135
135 136
136 137
137 138
138 139
139 140
140 141
141 142
142 143
143 144
144 145
145 146
146 147
147 148
148 149
149 150
150 151
151 152
152 153
153 154
154 155
155 156
156 157
157 158
158 159
159 160
160 161
161 162
162 163
163 164
164 165
165 166
166 167
167 168
168 169
169 170
170 171
171 172
172 173
173 174
174 175
175 176
176 177
177 178
178 179
179 180
180 181
181 182
182 183
183 184
184 185
185 186
186 187
187 188
188 189
189 190
190 191
191 192
192 193
193 194
194 195
195 196
196 197
197 198
198 199
199 200
200 201
201 202
202 203
203 204
204 205
205 206
206 207
207 208
208 209
209 210
210 211
211 212
212 213
213 214
214 215
215 216
216 217
217 218
218 219
219 220
220 221
221 222
222 223
223 224
224 225
225 226
226 227
227 228
228 229
229 230
230 231
231 232
232 233
233 234
234 235
235 236
236 237
237 238
238 239
239 240
240 241
241 242
242 243
243 244
244 245
245 246
246 247
247 248
248 249
249 250
250 251
251 252
252 253
253 254
254 255
255 256
256 257
257 258
258 259
259 260
260 261
261 262
262 263
263 264
264 265
265 266
266 267
267 268
268 269
269 270
270 271
271 272
272 273
273 274
274 275
275 276
276 277
277 278
278 279
279 280
280 281
281 282
282 283
283 284
284 285
285 286
286 287
287 288
288 289
289 290
290 291
291 292
292 293
293 294
294 295
295 296
296 297
297 298
298 299
299 300
300 301
301 302
302 303
303 304
304 305
305 306
306 307
307 308
308 309
309 310
310 311
311 312
312 313
313 314
314 315
315 316
316 317
317 318
318 319
319 320
320 321
321 322
322 323
323 324
324 325
325 326
326 327
327 328
328 329
329 330
330 331
331 332
332 333
333 334
334 335
335 336
336 337
337 338
338 339
339 340
340 341
341 342
342 343
343 344
344 345
345 346
346 347
347 348
348 349
349 350
350 351
351 352
352 353
353 354
354 355
355 356
356 357
357 358
358 359
359 360
360 361
361 362
362 363
363 364
364 365
365 366
366 367
367 368
368 369
369 370
370 371
371 372
372 373
373 374
374 375
375 376
376 377
377 378
378 379
379 380
380 381
381 382
382 383
383 384
384 385
385 386
386 387
387 388
388 389
389 390
390 391
391 392
392 393
393 394
394 395
395 396
396 397
397 398
398 399
399 400
400 401
401 402
402 403
403 404
404 405
405 406
406 407
407 408
408 409
409 410
410 411
411 412
412 413
413 414
414 415
415 416
416 417
417 418
418 419
419 420
420 421
421 422
422 423
423 424
424 425
425 426
426 427
427 428
428 429
429 430
430 431
431 432
432 433
433 434
434 435
435 436
436 437
437 438
438 439
439 440
440 441
441 442
442 443
443 444
444 445
445 446
446 447
447 448
448 449
449 450
450 451
451 452
452 453
453 454
454 455
455 456
456 457
457 458
458 459
459 460
460 461
461 462
462 463
463 464
464 465
465 466
466 467
467 468
468 469
469 470
470 471
471 472
472 473
473 474
474 475
475 476
476 477
477 478
478 479
479 480
480 481
481 482
482 483
483 484
484 485
485 486
486 487
487 488
488 489
489 490
490 491
491 492
492 493
493 494
494 495
495 496
496 497
497 498
498 499
499 500
500 501
501 502
502 503
503 504
504 505
505 506
506 507
507 508
508 509
509 510
510 511
511 512
512 Developing VMS programmes for Europe
Page 193
If you've noticed an error in this article please click here to report it so we can fix it.
)y C. D. Brown, C.Eng, MIMechE
4anager. application engineering, Cummins Engine Co Ltd, Darlington
6 HAS BEEN EXPLAINED in the complementary paper ,resented by M. C. Smith, the computer-based VMS programme as been developed and is widely used by Cummins Engine ;ompany in the USA to aid fleet management and vehicle builders. le purpose of this paper is to present some results which validate he simulation programme by comparing VMS runs with a test onducteal by Commercial Motor's technical editor. It was riginally planned that the Commercial Motor UK test route would
e used for this paper but, unfortunately, there has been some day in the loading of the route details into the computer. In place
f the UK route a comparison has been made with Commercial lotor test 6/71 where Tony Wilding reported on a Mercedes-Benz ,P1632 vehicle tested on a route in Germany.
It is proposed to follow the sequence of events of describing the oute, defining the vehicle/engine input data and to discuss the utput data from the simulation programme.
louts profiling The computer must be loaded with the information on the oute which affects the dynamic behaviour of the vehicle. It is ecessary to record mileage, road surface (which affects rolling esistance), grades, changes in direction, speed limits and any tops, traffic lights and road junctions. In addition to this essential iformation landmarks are also recorded so that the route can be ecognized.
Route profiling is quite straightforward and can be done by two eople in a car. The profile data is logged onto a route input form. L line of data is recorded when any of the essential characteristics hange or when a landmark is registered.
Mileages are recorded from the vehicle odometer (it is essential 3 know the accuracy of the instrument), altitude from the altimeter nd direction relative to North bylneans of a compass.
Roundabouts, which are obviously difficult to describe to the omputer, are considered to be speed restrictions. Road surfaces re classified into four grades from smooth (with low rolling esistance) to rough (with high rolling resistance).
The data accumulated is then programmed into the computer nd assigned a route profile number. A route profile can be printed ut on demand and will show all the discrete elements as well as a ummary of the total distance, altitude distribution, direction istribution, grade distribution and road class distribution.
ierman CM test route
The Commercial Motor test report CM6/71 was used for valiating the VMS programme in Europe. This route starts at tuttgart, proceeds by Autobahn El 1 to the outside of Munich, tough Munich to connect with Autobahn E6 to Ntirriburg and then y means of route E12 back to Stuttgart. A total distance of 348.2 files was recorded by Commercial Motor and 352.1 by VMS rofiling,
vehicle/engine data A full accurate specification of the vehicle and engine must be iaded into the computer before any VMS runs can be made. It is necessary to specify: For the vehicle:
i) Vehicle make and model. (b) Configuration, i.e. number of riven and non-driven axles. (c) Gross vehicle weight. (d) Cab ipe and width and height. (e) Body type. (1) Gearbox make and iodel. (g) Axle make and model. (h) Tyre sizes.
For the engine
L) Make and model. (b) Specific fuel consumption data. (c) Vide open throttle performance curve. (d) Accessories affecting power output, i.e. fan, power steering pump, alternator, etc. (e) Accurate specific fuel consumption data is absolutely essential and must be available in the form of part-load consumption curves at close intervals of engine speed.
VMS output data The computer is programmed to give steady-state performance as well as the dynamic route data. Steady-state information includes gear splits and gradeability curves, whereas dynamic output covers distance travelled, fuel used in gallons and mpg, number of gear changes made, average engine speed, percentage time at full throttle, percentage load factor and idle time. In addition, load distribution, vehicle speed distribution and gear-change patterns are given. The foregoing information can be supplemented by a detailed element by element performance as the simulation progresses through the route.
Comparison of the CM 6/71 test and VMS
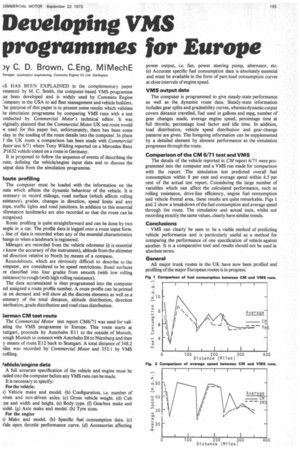
The details of the vehicle reported in CM report 6/71 were programmed into the computer and a VMS run made for comparison with the report. The simulation test predicted overall fuel consumption within 8 per cent and average speed within 4.5 per cent of the actual test report. Considering the large number of variables which can affect the calculated performance, such as rolling resistance, drive-line efficiency, engine fuel consumption and vehicle frontal area, these results are quite remarkable. Figs 1 and 2 show a breakdown of the fuel consumption and average speed through the route. The simulation and actual tests, whilst not recording exactly the same values, clearly have similar trends.
Conclusions VMS can clearly be seen to be a viable method of predicting vehicle performance and is particularly useful as a method for comparing the performance of one specification of vehicle against another. It is a comparative tool and results should not be used in absolute terms.
General All major trunk routes in the UK have now been profiled and profiling of the major European routes is in progress: