 1
1 2
2 3
3 4
4 5
5 6
6 7
7 8
8 9
9 10
10 11
11 12
12 13
13 14
14 15
15 16
16 17
17 18
18 19
19 20
20 21
21 22
22 23
23 24
24 25
25 26
26 27
27 28
28 29
29 30
30 31
31 32
32 33
33 34
34 35
35 36
36 37
37 38
38 39
39 40
40 41
41 42
42 43
43 44
44 45
45 46
46 47
47 48
48 49
49 50
50 51
51 52
52 53
53 54
54 55
55 56
56 57
57 58
58 59
59 60
60 61
61 62
62 63
63 64
64 65
65 66
66 67
67 68
68 69
69 70
70 71
71 72
72 73
73 74
74 75
75 76
76 77
77 78
78 79
79 80
80 81
81 82
82 83
83 84
84 85
85 86
86 87
87 88
88 89
89 90
90 91
91 92
92 93
93 94
94 95
95 96
96 97
97 98
98 99
99 100
100 101
101 102
102 103
103 104
104 105
105 106
106 107
107 108
108 109
109 110
110 111
111 112
112 113
113 114
114 115
115 116
116 117
117 118
118 119
119 120
120 121
121 122
122 123
123 124
124 125
125 126
126 127
127 128
128 129
129 130
130 131
131 132
132 133
133 134
134 135
135 136
136 137
137 138
138 139
139 140
140 141
141 142
142 143
143 144
144 145
145 146
146 147
147 148
148 149
149 150
150 151
151 152
152 153
153 154
154 155
155 156
156 157
157 158
158 159
159 160
160 161
161 162
162 163
163 164
164 165
165 166
166 167
167 168
168 169
169 170
170 171
171 172
172 173
173 174
174 175
175 176
176 177
177 178
178 179
179 180
180 181
181 182
182 183
183 184
184 185
185 186
186 187
187 188
188 189
189 190
190 191
191 192
192 193
193 194
194 195
195 196
196 197
197 198
198 199
199 200
200 201
201 202
202 203
203 204
204 205
205 206
206 207
207 208
208 209
209 210
210 211
211 212
212 213
213 214
214 215
215 216
216 217
217 218
218 219
219 220
220 221
221 222
222 223
223 224
224 225
225 226
226 227
227 228
228 229
229 230
230 231
231 232
232 233
233 234
234 235
235 236
236 237
237 238
238 239
239 240
240 241
241 242
242 243
243 244
244 245
245 246
246 247
247 248
248 249
249 250
250 251
251 252
252 253
253 254
254 255
255 256
256 257
257 258
258 259
259 260
260 261
261 262
262 263
263 264
264 265
265 266
266 267
267 268
268 269
269 270
270 271
271 272
272 273
273 274
274 275
275 276
276 277
277 278
278 279
279 280
280 281
281 282
282 283
283 284
284 285
285 286
286 287
287 288
288 289
289 290
290 291
291 292
292 293
293 294
294 295
295 296
296 297
297 298
298 299
299 300
300 301
301 302
302 303
303 304
304 305
305 306
306 307
307 308
308 309
309 310
310 311
311 312
312 313
313 314
314 315
315 316
316 317
317 318
318 319
319 320
320 321
321 322
322 323
323 324
324 325
325 326
326 327
327 328
328 329
329 330
330 331
331 332
332 333
333 334
334 335
335 336
336 337
337 338
338 339
339 340
340 341
341 342
342 343
343 344
344 345
345 346
346 347
347 348
348 349
349 350
350 351
351 352
352 353
353 354
354 355
355 356
356 357
357 358
358 359
359 360
360 361
361 362
362 363
363 364
364 365
365 366
366 367
367 368
368 369
369 370
370 371
371 372
372 373
373 374
374 375
375 376
376 377
377 378
378 379
379 380
380 381
381 382
382 383
383 384
384 385
385 386
386 387
387 388
388 389
389 390
390 391
391 392
392 393
393 394
394 395
395 396
396 397
397 398
398 399
399 400
400 401
401 402
402 403
403 404
404 405
405 406
406 407
407 408
408 409
409 410
410 411
411 412
412 413
413 414
414 415
415 416
416 417
417 418
418 419
419 420
420 421
421 422
422 423
423 424
424 425
425 426
426 427
427 428
428 429
429 430
430 431
431 432
432 433
433 434
434 435
435 436
436 437
437 438
438 439
439 440
440 441
441 442
442 443
443 444
444 445
445 446
446 447
447 448
448 449
449 450
450 451
451 452
452 453
453 454
454 455
455 456
456 457
457 458
458 459
459 460
460 461
461 462
462 463
463 464
464 465
465 466
466 467
467 468
468 469
469 470
470 471
471 472
472 473
473 474
474 475
475 476
476 477
477 478
478 479
479 480
480 481
481 482
482 483
483 484
484 485
485 486
486 487
487 488
488 489
489 490
490 491
491 492
492 493
493 494
494 495
495 496
496 497
497 498
498 499
499 500
500 501
501 502
502 503
503 504
504 505
505 506
506 507
507 508
508 509
509 510
510 511
511 512
512 Vehicle mission simulation
Page 187
Page 188
Page 189
Page 190
If you've noticed an error in this article please click here to report it so we can fix it.
by M. Chris Smith, MBA
Director, automotive power management, Cummins Engine Company, Columbus, USA
VEHICLE MISSION SIMULATION is one part of Cummins power management programme which has been developed to provide the truck industry with a series of management tools that result in the lowest total cost of fleet operation. The focus of vehicle mission simulation is on equipment specification. It can predict the physical and related financial performance of equipment alternatives, identify opportunities and correct problems before a truck is purchased.
The operation of vehicles in today's complex environment is a• very demanding activity, requiring ever increasing knowledge of all of its many facets. Pressures for effective operation are formidable in every aspect of fleet management. Management must be increasingly prepared to make the right decisions regarding equipment specification, financing, operation; maintenance and, finally, equipment resale. These "burdens of equipment ownership" are the key areas of decision making at which the truck company managements must become increasingly expert to ensure continued profitable operation.
Regarding any one of these elements, there is resident a great deal of "uncertainty" in trucking's complex environment. Cummins Engine Company, through its "power management'' programme, has identified these individual areas and now provides a series of programmes and systems to reduce and, in some cases, eliminate this uncertainty. This paper deals with one of these capabilities — vehicle mission simulation — a computer simulation programme designed to provide the industry with accurate engine, transmission and axle specification for any specific requirement prior to purchasing the actual equipment.
Every fleet operator and engineer wants a truck that performs as efficiently and economically as possible in the particular circumstances of his business. Within the familiar limits of what is available, or can be provided at an acceptable first cost, operators and engineers attempt to achieve this by selecting vehicles and, by combining calculation and experience, choosing what appears to best fulfil the requirements.
Vehicle mission simulation takes this process a big step forward through the use of a computer programme. Developed in the first instance to improve the• technique of designing and specifying trucks in the United States, it now has been broadened in application and will be available soon for use in the U.K.
In the broadest sense, a typical mission is a vehicle operating over a particular route, simulated on a computer by feeding in details of the route; the gradients, the speed limits, the intersections. To this are added the details of vehicle performance, combined, as explained later, to provide a detailed performance analysis of the equipment being considered.
The process of simulation involves the construction of computer models which are based on accurate data in every dimension. Already the vehicle mission simulation programme contains route profiles of 60,000 miles of roads in the United States, Canada and Mexico. Now, vehicle mission simulation wilt be available in the United Kingdom, beginning with Commercial Motor's London to Scotland test route, and expanding to include all major UK truck routes.
Using the exceptional calculating speed of a computer, the proposed truck specifications are simulated in the programme in a way which would be impossibly lengthy by other methods, until the best specification, based on the criteria for evaluation, for A particular operation over a particular route, is derived. The development of the vehicle mission simulation computer model The development of a piece of "software" such as the vehicle mission simulation computer model is not unlike the development of "hardware" such as a new engine. Before this "software" can be used in an operating situation, it must go through some form of the following steps: — "Design" and construction of a laboratory prototype.
• "Labotatory testing".
"RedeSign" into a production prototype.
"Field testing".
"Final phase" before "production" version.
Failure to carry out adequately the above steps in some form will Desult in software programme failure in the same manner that a new engine or vehicle might fail.
This particular simulation was designed and developed to simulate the operation of an on-highway truck. The vehicle performance model simulates the operation of a truck over a specific route and produces a "vehicle perforrnance report".
The vehicle performance model The heart of the programme is the logic by which the truck is operated, involving "decisions" such as what throttle position is selected, or when to shift gears.
Basic inputs which must be specified to compute performance describe the engine, transmission, axle and tyres, the truck configuration and the route over which the truck will travel. These items must be specified in considerable detail, but once this data is compiled for the computer and common routes, it can be stored in easily identified modules. This data must include: — Description of the engine The engine is described by a matrix relating fuel consumption characteristics to various operating speeds and torque outputs. The wide open throttle and torque curves are specified from idle to full rated power, including the governor cut-off curve. The engine output and temperature and altitude correction factors are also necessary parts of this input.
Transmission and axle description The gear ratios and transmission efficiencies of the various gears in the transmission and rear axle are specified as part of the description. The tyre revolutions per mile and driveline inertias are also included.
V6icle description The height and width of the vehicle, the gross vehicle or combination weight, are entered directly into the computer. A description of the vehicle type and configuration is necessary so that the proper coefficients can be applied to compute power requirements. Wind resistance and rolling resistances are included in this description.
Description of the route The route over which the vehicle is to travel must be described for the computer. This is done by breaking the road into discrete segments: each describing the direction of travel, length of the segment, its altitude, any practical speed limit imposed, and the type of road surface. In addition, the computer can accept description of landmarks along the route (so that the output can be correlated with the experience of people used to operating on the route) and indications of traffic level and traffic control such as traffic lights, so'that the vehicle can make appropriate speed changes and stops. Since this system was put into operation approximately four years ago, the number of routes described in the computer has grown in an exponential manner until today it encompasses some 60;000 miles of roads in the continental United States, Canada and Mexico. The CM road test route is our starting point for England. Current plans call for the addition of profiling all major UK truck routes by March 1973.
The performance model simulates the vehicle as it travels along the road using the input described above. The model will simulate the shifting of gears, observation of speed limits, traffic lights and stop signs. Sharp curves and other road hazards are accounted for by posting artificially low speed limits where appropriate.
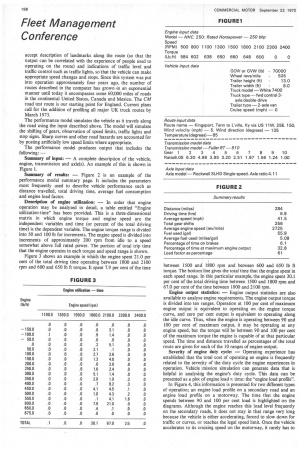
The performance model produces output that includes the following: Summary of input: A complete description of the vehicle, engine, transmission and axle(s). An example of this is shown in Figure 1.
Summary of results: Figure 2 is an example of the performance model summary page. It includes the parameters most frequently used to describe vehicle performance such as distance travelled, total driving time, average fuel consumption and engine load factor.
Description of engine utilization: In order that engine operation may be analysed in detail, a table entitled "Engine utilization-time" has been provided. This is a three-dimensional matrix in which engine torque and engine speed are the independent variables and time (or percent of the total driving time) is the dependent variable. The engine torque range is divided into 50 and 100 lb for increments. The engine speed is divided into increments of approximately 200 rpm from idle to a speed somewhat above full rated power. The portion of total trip time that the engine operates in each torque and speed range is shown.
Figure 3 shows an example in which the engine spent 21.0 per cent of the total driving time operating between 1800 and 2100 rpm and 600 and 650 lb ft torque. It spent 7.9 per cent of the time
between 1500 and 1800 rpm and between 600 and 650 lb ft torque. The bottom line gives the total time that the engine spent in each speed range. In this particular example, the engine spent 30.1 per cent of the total driving time between 1500 and 1800 rpm and 67.0 per cent of the time between 1800 and 2100 rpm.
Engine output statistics: Engine output statistics are also available to analyse engine requirements. The engine output torque is divided into ten ranges. Operation at 100 per cent of maximum engine output is equivalent to operating on the engine torque curve, and zero per cent output is equivalent to operating along the idle curve. Thus, when the engine is operating between 90 and 100 per cent of maximum output, it may be operating at any engine speed, but the torque will be between 90 and 100 per cent of the maximum torque the engine is capable of at that particular speed. The time and distance travelled as percentages of the total route are given for each of the 10 ranges of engine output.
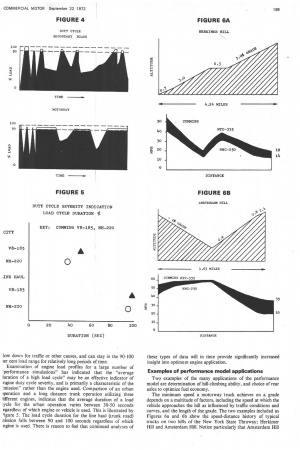
Severity of engine duty cycle: Operating experience has established that the total cost of operating an engine is frequently related to the severity of the duty cycle the engine experiences in operation. Vehicle Imission simulation can generate data that is helpful in analysing the engine's duty cycle. This data can be presented as a plot of engine load v. time: the "engine load profile".
In Figure 4, this information is presented for two different types of operation; an engine load profile on a secondary road and an engine load profile on a motorway. The time that the engine spends between 90 and 100 per cent load is highlighted on the diagrams. Although the engine reaches this load level frequently on the secondary roads, it does not stay in that range very long because the vehicle is either accelerating, forced to slow down for traffic or curves, or reaches the legal speed limit. Once the vehicle accelerates to its cruising speed on the motorway, it rarely has to low down for traffic or other causes, and can stay in the 90-100 )er cent load range for relatively long periods of time.
Examination of engine load profiles for a large number of 'performance simulations" has indicated that the "average luration of a high load cycle" may be an effective indicator of :ngine duty cycle severity, and is primarily a characteristic of the 'mission" rather than the engine used. Comparison of an urban
■ peration and a long distance trunk operation utilizing three lifferent engines, indicates that the average duration of a load :ycle for the urban operation varies between 30-50 seconds egardless of which engine or vehicle is used. This is illustrated by 7igure 5. The load cycle duration for the line haul (trunk road) nission falls between 90 and 100 seconds regardless of which ngine is used. There is reason to feel that continued analyses of
these types of data will in time provide significantly increased insight into optimum engine application.
Examples of performance model applications
Two examples of the many applications of the performance model are determination of hill-climbing ability, and choice of rear axles to optimize fuel economy.
The minimum speed a motorway truck achieves on a grade depends on a multitude of factors, including the speed at which the vehicle approaches the hill as influenced by traffic conditions and curves, and the length of the grade. The two examples included as Figures 6a and 6b show the speed-distance history of typical trucks on two hills of the New York State Thruway; Herkimer Hill and Amsterdam Hill. Notice particularly that Amsterdam Hill
is—short and has a high speed approach so that a 250 bhp engine can "top the hill" at the desired minimum speed of 20 mph, although its equilibrium velocity on the same grade would be about 14 mph.
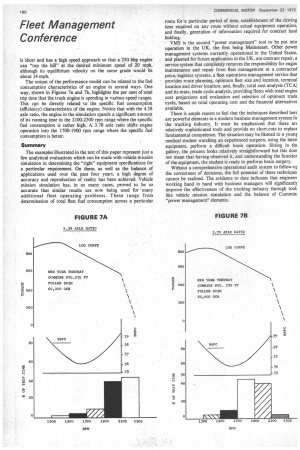
The output of the performance model can be related to the fuel consumption characteristics of an engine in several ways. One way, shown in Figures 7a and 7b, highlights the per cent of total trip time that the truck engine is spending in various speed ranges. This can be directly related to the specific fuel consumption (efficiency) characteristics of the engine. Notice that with the 4.38 axle ratio, the engine in the simulation spends a significant amount of its running time in the 2100-2300 rpm range where the specific fuel consumption is rather high, A 3.70 axle ratio shifts engine operation into the 1700-1900 rpm range where the specific fuel consumption is better.
Summary
The examples illustrated in the text of this paper represent just a few analytical evaluations which can be made with vehicle Mission simulation in determining the "right" equipment specifications for a particular requirement. On these, as well as the balance of applications used over the past four years, a high degree of accuracy and reproduction of reality has been achieved. Vehicle mission simulation has, in so many cases, proved to be so accurate that similar results are now being used for many additional fleet operating problems. These range from determination of total fleet fuel consumption across a particular
route for a particular -period of time, establishment of the driving time required on any route without actual equipment operation, and finally, generation of information required for contract haul bidding.
VMS is the second "power management" tool to be put into operation in the UK, the first being Mainsteam. Other power management systems currently operational in the United States, and planned for future application in the UK, are contract repair, a service system that completely removes the responsibility for engin( maintenance and repair from fleet management at a contracted price, logistics systems, a fleet operations management service that provides route planning, optimum fleet size and location, terminal location and driver location; and, finally, total cost analysis (TCA) and its mate, trade cycle analysis, providing fleets with total engine cost projections and evaluation and selection of optimum trade cycle, based on total operating cost and the financial alternatives available.
There is ample reason to feel that the techniques described here are powerful elements in a modern business management system fo the trucking industry. It must be emphasized that these are relatively sophisticated tools and provide no short-cuts to replace fundamental competence. The situation may be likened to a young medical student watching an experienced surgeon, using the latesi equipment, perform a difficult brain operation. Sitting in the gallery, the process looks relatively straightforward but this does not mean that having observed it, and understanding the functior of the equipment, the student is ready to perform brain surgery.
Without a comprehensive operational audit system to follow-ur the correctness of decisions, the full potential of these techniques cannot be realized. The evidence to date indicates that engineers working hand in hand with business managers will significant13 improve the effectiveness of the trucking industry through tools like vehicle mission simulation and the balance of Cummins "power management" elements.