


14. Historical or budgeted costs?
Page 52
Page 53
If you've noticed an error in this article please click here to report it so we can fix it.
cause and effect
DO NOT be surprised at the questions put to the cost analyst (CM November 7) after completing the first month's "Trading Results" on Form RB7. Notwithstanding the fact that neither operator had bothered about costing hitherto—at least not in such detail— they are now inspired to gather information on future profit potential or cost ratios to turnover with as much impatience as might be demonstrated by an operator with a long cost history at his fingertips.
Nevertheless, this is encouraging for the cost analyst. Management is now being alerted to take an interest in an otherwise neglected area of operation in which the escalating cost of delivering goods by road, whether on own-account or otherwise, is bound to have an effect on profit margins, unless prices or haulage rates can be cidjusted accordingly.
I have previously condemned such rises, as the unit cost can be reduced by improved utilization of the vehicles, also by the own account operator in reducing his establishment cost to that commensurate with the return expected on the capital employed. This is a valid argument as a private carrier can always opt out of any investment in transport. Nevertheless, he is frequently reluctant to do so for fear of giving away a
profit that he might otherwise save, not knowing that the haulage industry is currently fifth in the bankruptcy league and had it not been for two companies that failed in other industries, would have had the doubtful honour of being placed third. Give me costing any time.
As there can be no prospect of a price or rates increase the cost analyst will take a clinical look at the performance and operating costs of each unit in the fleet. From this he will deduce that as with Fleet No. 1001 so with certain others there is evidence of under utilization. In examining operating expenses he suspects that tyre costs of £299 in one month are abnormal for a six-vehicle/trailer fleet despite the fact that this agrees with the "tyre account" in the Purchase Day Book. This observation reveals that at this rate of expenditure, tyres could cost some £3,600 per annum or 4.6d per mile including trailers and which is not supported by the mileage covered. On the other hand repair costs averaged £41 per earning unit but then £30 of this was attributable to the fitter and workshop overheads.
Haulier's profit The own-account operator's cost analyst had made the point about the establishment cost figure so there was really nothing else that could be said to be exceptional. From the figures available and given a reasonable budget for tyre expenditure it did appear therefore that the haulier's profit could be in the order of £600 per month.
The investigation into the own-account operator's results revealed that the cost ratio to "sales" was almost 2.5 per cent for the fleet as a whole although the cost analyst had yet to calculate the percentage for each group of vehicles.
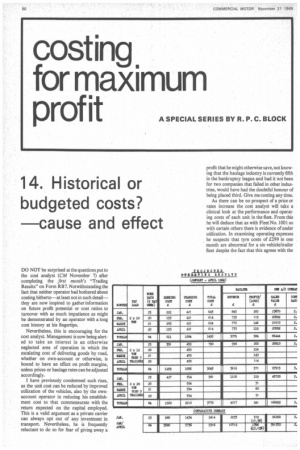
Neither cost analyst was satisfied that a single month's operating results was really long enough to establish the pattern for the future; consequently to ensure that the right answers were given to the haulier and ownaccount operator's questions it would be prudent to continue the performance/costing exercise for at least another three months. In principle they were right, although I would prefer to sec six months' figures. However, in both cases management was adamant that the information now to hand should at least point the way. In the event each cost analyst undertook to project four months' figures to the end of April, having been told that the trading pattern would be similar or at least pro rata to the January experience. The projected results for each operation are incorporated in the schedule reproduced here.
Fluctuating effect At first, note the reduction in working days in each of the months from February to April as in calendar month exercises these variants will have a fluctuating effect on operating results as is shown by the figures. Remember that the cost analyst has been told that trading, and thus utilization, will be about the same as in January, but if that month is regarded as the optimum then the lesser number of days available in the remaining months will result in lower mileages and thus lower running costs and also lower "revenue" or "sales value", relative to the 23-day month of January. The one important expense that will not be affected is the standing cost, and in order to emphasize this 1 have repeated it monthly in each group of vehicles.
If you refer back to Form RB 7 for January you can trace the source of each of the relevant group totals illustrated here with the exception of the own-account operator's cost ratios.
Taking the first group, the two 10-ton vehicles, the monthly figures projected in each column are relative to the month of January, taking into account the reduced number of working days, with the exception of the standing cost which will not vary_ In this group Form RB7 showed that the profit made by the haulier in January was £200 but, as the cost analyst was told that the trading pattern would be similar, i.e. pro rata, in the following months, then the effect on profit which is mainly due to a reduction in revenue, without a corresponding reduction in standing cost is clear to see. The same principle has been applied to the own-account operator's sales value, and so by the end of April the haulier's profit for this group is only £584, while the cost ratio to turnover for the own-account operator has increased marginally to 2.88 per cent mainly due to the better utilization of vehicle GHJ 789C in January.
Disconcerting For the sake of clarity I have not completed all the monthly calculations in the 12and 20-ton groups but I have shown the haulier's monthly profit performance in each group. The result obtained by the 20-tonners is disconcerting, bearing in mind that in this group we have the lowest standing cost per ton of payload and the highest investment. However, the abnormal running costs incurred in January, i.e. £427 (tyres £137), together with the under-utili7ation of capacity and low rates has produced a sub-normal profit which should not be repeated. Conversely it is this group that produces the lowest unit cost for the own-account operator, mainly on account of the high volume carried, despite the abnormal operating cost experience. It certainly appears, therefore, that the high tonnage delivered by the 12-tonners is at a relatively higher cost and so this type of vehicle is unsuitable.
The Comparative Summary highlights the relative reduction in revenue and profit aggravated by the standing cost over the period projected for the haulier—the figures in brackets being the percentage of profit to turnover. The overall increase in the ownaccount operator's transport cost to sales value, relative to the January experience, may appear to be minimal at first sight. Nevertheless, it represents a drop in sales of over £21,000 or an increase in costs of approximately £500 over the period.
Future profits The answer to the haulier's question on future profit potential, based on the same cost and trading pattern, can be ascertained by the profit made in the average working day/ month, i.e. March (21 days), and consequently if this pattern continues, the profit forecast for the year would be £4,188 calculated on 252 (21 x 12) working days as opposed to £6,228 calculated on 276 (23 x 12) working days.
This surely points to the need to establish an optimum number of working days per month throughout the year, e.g. 13 x 4 weekly periods, so that all the standing costs can be recovered in that period, including fitter's labour and workshop overheads, and which in this particular exercise have been included in running costs, but which, if added to standing costs at the rate of £180 per month, would have produced an even less favourable result than that illustrated; so let's not be misled.
It follows, therefore, that regardless of the nature of the operation or the number of vehicles employed, that proportion of own workshop costs, represented by labour and overheads, should be regarded as standing costs. This was apparent in the month of January when the summary on Form RB7 revealed that repair costs totalled £245 of which 66.6 per cent was a recurring cost.
If, on the other hand, vehicle maintenance is required to be expressed as a cost per mile then the cost analyst should first calculate the average total repair cost per vehicle! month over a period of time, and preferably in groups of similar payload make or function, etc. This is easily ascertained from Form R B7. The monthly average cost, multiplied by the number of vehicles in the group, is then divided by the mileage covered in each group to arrive at the maintenance cost per mile.
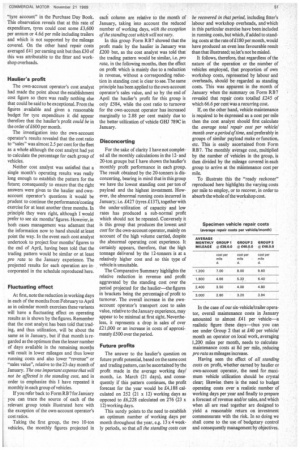
To illustrate this the "ready reckoner" reproduced here highlights the varying costs per mile to employ, or to recover, in order to absorb the whole of the workshop cost.
In the case of our six-vehicle/trailer operator, overall maintenance costs in January amounted to almost £41 per vehicle—a realistic figure these days—thus you can see under Group 2 that at £40 per vehicle/ month an operator on local work, averaging 1,200 miles per month, needs to calculate maintenance costs at 8d per mile, reducing pro rata as mileages increase.
Having seen the effect of all standing costs on profit, whether earned by haulier or own-account operator, the need for maximum vehicle utilization should be crystal clear; likewise there is the need to budget operating costs over a realistic number of working days per year and finally to prepare a forecast of revenue and/or sales, and which when all are read together are designed to yield a reasonable return on investment commensurate with the risk. In so doing we shall come to the use of budgetary control and consequently management by objectives.