


Testing, testin testi!,
Page 25
Page 26
Page 27
Page 28
If you've noticed an error in this article please click here to report it so we can fix it.
Truck and trailer roadworthiness just keeps on getting better, according to the latest numbers from Vosa. CM dissects the data, studying the long-term trends to find the facts behind the figures Words: David Wilcox Vosa 's Latest annual Effectiveness Report, covering the period from 1 April 2011 to 31 March 2012, shows trucks achieved a record-breaking performance at their annual roadworthiness test, with 75.3% passing at the first attempt. Vosa prefers to quote a test failure rate of 24.7% but, whichever way you look at it, it is the best figure on record. The same can be said for trailers, with a failure rate of 17.3%.
Both figures have been improving steadily over the past six years. Only 10 years ago, 40% of trucks and 30% of trailers were failing their tests.
A number of factors have contributed to the improvement. Headlamp aim requirements eased four years ago. Smarter enforcement targeting by Vosa, including the use of the OCRS, has helped improve the roadworthiness and test performance of truck operators with below-par records.
OCRS scores have also raised operators' awareness of test records. According to Vosa, operators are "taking greater responsibility for their maintenance and taking greater credit for improvement". Vosa says advancements in vehicle technology have played a part too.
ATF - abolishing test failures There is no doubt that the shift of testing from Vosa's goods vehicle test stations (GVTS) to the burgeoning number of authorised testing facilities (ATFs) during the past three years has contributed greatly towards the improvement.
"That was, after all, one of the predictable benefits likely to accrue from using more ATFs, as vehicle condition won't change much in the marshalling yard and on a trip to a distant Vosa GVT there was always the possibility of a defect occurring," says a Vosa spokesperson. That, of course, assumes the vehicle is being maintained and prepared for test on the same ATF site.
The effect of ATFs on test performance is evident in the latest Vosa data. The failure rate for truck tests conducted at Vosa GVTS is 25.4%, compared with 23.4% at non-Vosa sites —ATFs and designated premises (DPs). There is an even larger difference in the trailer rates: 18.5% at GVTS compared with 15.8% at non-Vosa sites.
Better on the buses?
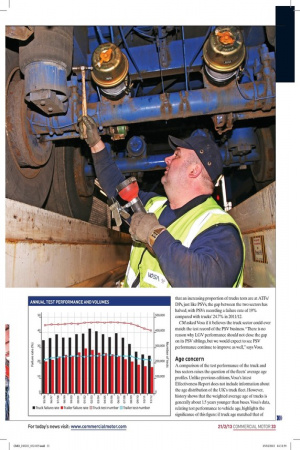
Vosa forecasts this beneficial effect of ATFs partly because of its experience with DPs, which for many years have carried out about 35% of all bus and coach tests. The passenger service vehicle (PSV) industry has long achieved a first-time test pass record significantly better than the truck sector's. When 40% of trucks were failing, PSVs were regularly achieving a rate of about 27%. Now that an increasing proportion of trucks tests are at ATFs/ DPs, just like PSVs, the gap between the two sectors has halved, with PSVs recording a failure rate of 19% compared with trucks' 24.7% in 2011/12.
CM asked Vosa if it believes the truck sector could ever match the test record of the PSV business. "There is no reason why LGV performance should not close the gap on its PSV siblings, but we would expect to see PSV performance continue to improve as well," says Vosa.
Age concern A comparison of the test performance of the truck and bus sectors raises the question of the fleets' average age profiles. Unlike previous editions,Vosa's latest Effectiveness Report does not include information about the age distribution of the UK's truck fleet. However, history shows that the weighted average age of trucks is generally about 1.5 years younger than buses.Vosa's data, relating test performance to vehicle age, highlights the significance of this figure: if truck age matched that of buses, the average truck test failure rate would be 5% to 6% higher. Our graph (below right) reveals one key difference between the two sectors. Whereas the failure rate of buses between the ages of seven and 11 years remains relatively stable, the failure rate of trucks goes on climbing steeply during this period of their life. The most likely explanation is that many buses of this age remain within the care of big in-house bus workshops, but many trucks will have already dropped out of top-tier maintenance contracts.
Little and large Vosa's report shows a strong correlation between fleet size and test performance, with failure rate rising as fleet size diminishes. But it is unsafe to conclude that small is necessarily bad.
Fleet size might not be the only relevant factor behind these statistics — it could be, for example, that the average age of trucks is higher in small fleets than in big ones. Crossreferencing the data would help clarify whether size really matters to the degree that these bare numbers suggest.
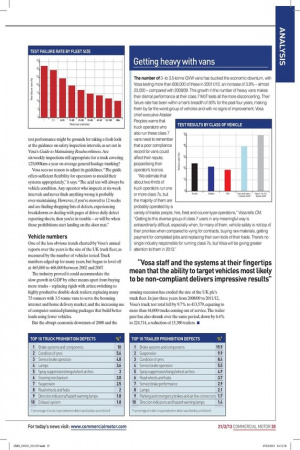
Defects The top 10 test failure reasons for trucks and trailers remain broadly the same, apart from the fact that the incidence of each is, for the most part, declining.
Although incorrect headlamp aim remains easily the most dominant cause of truck test failure,Vosa's decision to ease the aim rules in February 2009 has halved the size of the problem — in 2006/07 nearly 24% of trucks failed because of wayward headlamp aim.
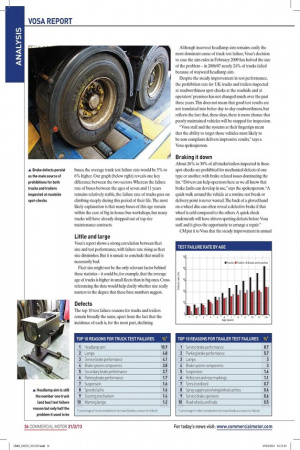
Despite the steady improvement in test performance, the prohibition rate for UK trucks and trailers inspected at roadworthiness spot-checks at the roadside and at operators' premises has not changed much over the past three years. This does not mean that good test results are not translated into better day-to-day roadworthiness, but reflects the fact that, these days, there is more chance that poorly maintained vehicles will be stopped for inspection.
"Vosa staff and the systems at their fingertips mean that the ability to target those vehicles most likely to be non-compliant delivers impressive results," says a Vosa spokesperson.
Braking it down About 26% to 30% of all trucks/trailers inspected in these spot-checks are prohibited for mechanical defects of one type or another, with brake-related issues dominating the list. "Drivers can help operators here as we all know that brake faults can develop in use," says the spokesperson. "A quick walk around the vehicle at a routine rest break or delivery point is never wasted. The back of a gloved hand on a wheel disc can often reveal a defective brake if that wheel is cold compared to the others. A quick check underneath will have drivers spotting defects before Vosa staff and it gives the opportunity to arrange a repair."
CM put it to Vosa that the steady improvement in annual test performance might be grounds for taking a fresh look at the guidance on safety inspection intervals, as set out in Vosa's Guide to Maintaining Roadworthiness. Are six-weekly inspections still appropriate for a truck covering 125,000kms a year on average general haulage trunking?
Vosa sees no reason to adjust its guidelines. "The guide offers sufficient flexibility for operators to mould their systems appropriately," it says. "The acid test will always be vehicle condition. Any operator who inspects at six-week intervals and never finds anything wrong is probably over-maintaining. However, if you've moved to 12 weeks and are finding shopping lists of defects, experiencing breakdowns or dealing with pages of driver daily defect reporting sheets, then you're in trouble — or will be when those prohibitions start landing on the door mat."
Vehicle numbers One of the less obvious trends charted by Vosa's annual reports over the years is the size of the UK truck fleet, as measured by the number of vehicles tested. Truck numbers edged up for many years, but began to level off at 465,000 to 468,000 between 2002 and 2007.
The industry proved it could accommodate the slow growth in GDP by other means apart from buying more trucks — replacing rigids with artics; switching to highly productive double-deck trailers; replacing many 7.5-tonners with 3.5-tonne vans to serve the booming internet and home delivery market; and the increasing use of computer-assisted planning packages that build better loads using fewer vehicles.
But the abrupt economic downturn of 2008 and the ensuing recession has eroded the size of the UK plc's truck fleet. In just three years from 2008/09 to 2011/12, Vosa's truck test total fell by 9.7% to 413,579, equating to more than 44,000 trucks coming out of service. The trailer parc has also shrunk over the same period, down by 6.4% to 224,714, a reduction of 15,380 trailers. • TOP 10 REASONS FOR TRUCK TEST FAILURES (1/0* 1 Headlamp aim 10.9 2 Lamps 4.8 3 Service brake performance 4.1 4 Brake system components 3.8 5 Secondary brake performance 2.7 6 Parking brake performance 1.7 7 Suspension 1.6 8 Speedo/tacho 1.6 9 Steering mechanism 1.4 10 Warning lamps 1.2 f* percentage of trucks tested where item was listed as a reason for failure] TOP 10 REASONS FOR TRAILER TEST FAILURES (1/0* 1 Service brake performance 8.7 2 Parking brake performance 5.7 3 Lamps 3 4 Brake system components 3 5 Suspension 1.6 6 Reflectors and rear markings 1.1 7 Tyres (condition] 0.7 8 Spray suppression/wings/wheel arches 0.6 9 Service brake operation 0.6 10 Road wheels and hubs 0.5 f* percentage of trailers tested where item was listed as a reason forfaiturel Getting heavy with vans The number of 3to 3.5-tonne GVW vans has bucked the economic downturn, with Vosa testing more than 608,000 of these in 20011/12, an increase of 3.9% — almost 23,000— compared with 2008/09. This growth in the number of heavy vans makes their dismal performance at their class 7 MoT tests all the more disconcerting. Their failure rate has been within a hair's breadth of 50% for the past four years, making them by far the worst group of vehicles and with no signs of improvement. Vosa chief executive Alastair Peoples warns that truck operators who also run these class 7 vans need to remember that a poor compliance record for vans could affect their repute, jeopardising their operator's licence.
"We estimate that about two-thirds of truck operators run one or more class 7s, but the majority of them are probably operated by a variety of trades people, hire, fleet and courier-type operations," Vosa tells CM. "Getting to this diverse group of class 7 users in any meaningful way is extraordinarily difficult, especially when, for many of them, vehicle safety is not top of their priorities when compared to vying for contracts, buying raw materials, getting payment for completed jobs and replacing their own tools of their trade. There's no single industry responsible for running class 7s, but Vosa will be giving greater attention to them in 2013."
TOP 10 TRUCK PROHIBITION DEFECTS %* 1 Brake systems and components 10 2 Condition of tyres 5.6 3 Service brake operation 4.8 4 Lamps 3.6 5 Spray suppression/wings/wheel arches 3 6 Steering mechanism 2.8 7 Suspension 2.5 8 Road wheels and hubs 2 9 Direction indicators/hazard warning lamps 1.8 10 Exhaust system 1.8 f* percentage of trucks inspected where defect was listed as a prohibition] TOP 10 TRAILER PROHIBITION DEFECTS ok* 1 Brake systems and components 19.9 2 Suspension 9.9 3 Condition of tyres 8.4 4 Service brake operation 5.5 5 Spray suppression/wings/wheel arches 4.9 6 Road wheels and hubs 3.7 7 Service brake performance 2.9 8 Lamps 2.1 9 Parking and emergency brakes and air line connectors 1.7 10 Direction indicators and hazard warning lamps 1.4 f* percentage of trailers inspected where defect was listed as prohibition]