COSTS THAT COUNT (6)
Page 55

If you've noticed an error in this article please click here to report it so we can fix it.
by David Lowe, MInstTA, AMBIM THE THREE BASIC constituents of vehicle costing, standing costs, establishment costs and running costs have already been discussed and now I come to the fourth element — total operating costs. These were mentioned in the introductory article to this series.
Total operating cost is the combination of the three basic individual elements in one usable cost measure based on either mileage or time. As standing and establishment costs were originally calculated on a time basis and running costs on a mileage basis, depending on which measure of operating cost is required, a conversion from one to the other will have to be made. This is a simple task provided the weekly, monthly or annual mileage for individual vehicles is recorded.
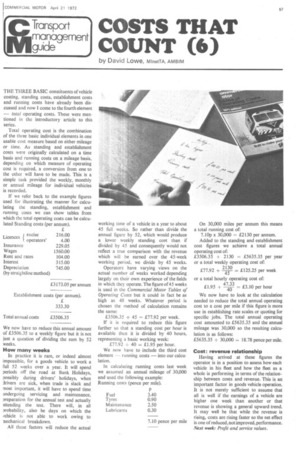
If we refer back to the example figures used for illustrating the manner for calculating the standing, establishment and running costs we can show tables from which the total operating costs can be calculated Standing costs (per annum).
We now have to reduce this annual amount of £3506.35 to a weekly figure but it is not just a question of dividing the sum by 52 weeks.
How many weeks
In practice it is rare, or indeed almost impossible, for a goods vehicle to work a full 52 weeks over a year. It will spend periods off the road at Bank Holidays, possibly during drivers' holidays, when drivers are sick, when trade is slack and most important, it will have to spend time undergoing servicing and maintenance, preparation for the annual test and actually attending the test. There will, in all probability, also be days on which the vehicle is not able to work owing to mechanical breakdown.
All these factors will reduce the actual
working time of a vehicle in a year to about 45 full weeks. So rather than divide the annual figure by 52, which would produce a lower weekly standing cost than if divided by 45 and consequently would not reflect a true comparison with the revenue which will be earned over the 45-week working period, we divide by 45 weeks.
Operators have varying views on the actual number of weeks worked depending largely on their own experience of the fields in which they operate. The figure of 45 weeks is used in the Commercial Motor Tables of Operating Costs but it could in fact be as high as 48 weeks. Whatever period is chosen the method of calculation remains the same:
£3506.35 -± 45 = £77.92 per week.
If it is required to reduce this figure further so that a standing cost per hour is available then it is divided by 40 hours, representing a basic working week: £77.92 ÷ 40 = £1.95 per hour.
We now have to include the third cost element — running costs — into our calculation.
In calculating running costs last week we assumed an annual mileage of 30,000 and used the following example: Running costs (pence per mile). On 30,000 miles per annum this means a total running cost of: 7.10p x 30,000 = £2130 per annum.
Added to the standing and establishment cost figures we achieve a total annual operating cost of: £3506.35 + 2130 = £5635.35 per year or a total weekly operating cost of:
£77.92 + —2130 = £125.25 per week 45
or a total hourly operating cost of: £1.95 + — £3.10 per hour 40 We now have to look at the calculation needed to reduce the total annual operating cost to a cost per mile if this figure is more use in establishing rate scales or quoting for specific jobs. The total annual operating cost amounted to £5635.35 and the annual mileage was 30,000 so the resulting calculation is as follows: £5635.35 ÷ 30,000 = 18.78 pence per mile.
Cost: revenue relationship Having arrived at these figures the operator is in a position to assess how each vehicle in his fleet and how the fleet as a whole is performing in terms of the relationship between costs and revenue. This is an important factor in goods vehicle operation. It is not merely sufficient to assume that all is well if the earnings of a vehicle are higher one week than another or that revenue is showing a general upward trend. It may well be that while the revenue is rising, costs are rising faster so the net effect is one of reduced, not improved, performance. Next week: Profit and service values.


