


New Regulation Emphasizes In urtance of Costs
Page 20
Page 21
If you've noticed an error in this article please click here to report it so we can fix it.
AN indirect effect Of the new regulation which limits the increase in hauliers' charges, to
7/ per cent. above what they were in October, 1940, will be that the haulier who has not been in the habit of recording all his expenses will be at a serious disadvantage.
In my ,previous article I stated that whilst the new regulation fixed the maximum increase at
7/ per cent., it did give the haulier whose costs had increased to a greater extent than this amount an opportunity for claiming that the conditions, and his actual increase in expenditure, justified charges higher than the regulation would otherwise permi t.
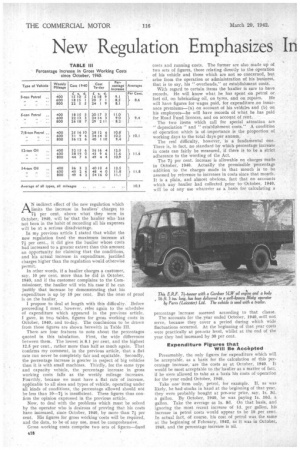
In other words, if a haulier charges a customer, say, 10 per cent, more than he did in October, 1940, and if the customer complains to the Commissioner, the haulier will win his case if he can justify that increase by demonstrating that his expenditure is up by 10 per cent. But the onus of proof is on the haulier, I propose to deal at length with this difficulty.. Before proceeding I must, however, refer again to the schedules of expenditure which appeared in the previous article. I gave, in two tables, figures for gross working costs in October, 1940,. and to-day. The conclusions to be drawn from those figures are shown herewith in Table III.
There are four features to note about the percentages quoted in this tabulation, First, the wide differences between them. The lowest is 8.1 per cent. and the highest 12.5 per cent., rather more than half as much again. That confirms my comment, in the previous article, that a fiat rate can never be completely fair and equitable. Secondly, the percentage increase is greater in respect of big vehicles than it is with small machines. Thirdly, for the same type and capacity vehicle, the percentage increase in gross working costs falls as the weekly mileage increases. Fourthly, because we must have a flat rate of increase, applicable to all sizes and types of vehicle, operating under all kinds of conditions, the percentage allowed should not be less than 10-7i is insufficient. These figures thus confirm the opinion expressed in the previous article.
Now, to deal with the problems which must be solved by the operator who is desirous of proving that his costs have increased, since October, 1940, by more than 7i per cent. His figures for gross working costs will be required, and the data, to be of any use, must be comprehensive.
Gross working costs comprise two sets of figures—fixed percentage increase assessed according to that clause. The accounts for the.year ended October, 1940, 'will not serve, because they cover a period during which wide fluctuations occurred. At the beginning of that year costs were practically at pre-war level, whilst at the end of the year they had increased by 30 per cent.
Expenditure Figures that Will Be Accepted Presumably, the only figures for expenditure which will be acceptable, as a basis for the calculation of this percentage increase, are the costs as at October, 1940. It would be most acceptable to the'haulier as a matter of fact, if he Were allowed to take as a basis his costs of-operation for the year ended October, 1940.
Take one item only, petrol, for example. If, as was likely, he had stocks in hand at the beginning of that year, they were probably bought at pre-war price, say, Is. 3d. a gallon. By October, 1940, he was paying ls. 10d. a gallon. Take the average as ls. 8d. On that basis, and ignoring the most recent increase of -Id. per gallon, his increase in petrol costs would appear to be 10 per cent. In actual fact, of course, his cost of petrol was the same at the beginning of February, 1942, as it was in October, 1940, and the percentage increase is nil. The same situation arises in connection with most of the items of running costs. Some indeed, sufferect even greater variations than petrol. A special instance is tyres. The prices of tyres have -been increased five times since September, 1939. The total, percentage increase, to October, 1940, was approximately 24. Now if a haulier had laid in a good stock of tyres at pre-war prices he might claim that his tyre costs during the year totalled, say, £200. The corresponding figure for this year, including a further increase of 5 per cent. during August, 1941, might be 2260, an increase of no less than 30 per cent.
Actually, of course, his tyre costs (so far. as giant tyres are concerned), computed at October, 1940. would be £248 and the cost to-day £260, showing an increase of not more than 5 per cent.
Now, that sort of thing can be shown to apply to practically every item of operating costs, excepting only the Road Fund licences. If, therefore, the haulier were to take his actual recorded costs for a period of a year or more prior to October, 1940, as a basis -for measuring the percentage increase since that date, he would not 'have the slightest difficulty in proving a step-up of not merely 10, but more like 15 to 20 per cent.
Another Angle on Presentation of Proof Of course, if the Regional Transport Commissioners could be persuaded to accept those figures, well and good. The probability of that happening, however, is extremely remote—in fact I fear it must be altogether dismissed and the problem of presentation of proof considered from another angle.
The haulier must compute what his costs were during October, 1940, using his own recorded figures as a guide. The figures in Tables I and II (in the previous article) and in Table III, herewith, were obtained in that way.
' It will be necessary to treat each vehicle of a miscellaneous fleet separately. In a • homogeneous fleet of vehicles, all the same type and size, the figures for one may stand for all. Take the case of a 7-8-ton petrol vehicle, and assume that the operator's experience was such as to give the following results:—Fuel consumption, equal to 64 m.p.g. ; oil consumption, equal to 350 m.p.g.; tyres, 24,000 miles per set; maintenance, pre-war, lid. per mile, of which id, was for materials and Id. for labour; depreciation, a life of 200,000 miles, Now, in October, 1940, petrol was costing Is. 9d. per gallon to the large user, buying in bulk; the cost per mile for fuel was, therefore, 3.28d. To-day, the price is is. 10d. and the cost per mile 3.39d. Oil is bought at all sorts of prices. In October, 1940, it probably cost, in bulk, about 4s. per gallon, so that the cost per mile was 0.137d. To-day, the price is 4s. 4d. per gallon and the cost per mile 0.149d.
The cost of a set of tyres at the critical date would be about £90 and the cost per mile 0.90d. To-day, the price is £95 and the cost per mile 0.95d. The cost of spares had risen, at October, 1940, by I2i per cent., so that the pre-war cost of id. per mile had risen to 0.28d. There has been a slight addition, bringing the total increase, as cornpared with pre-war, to 15 per cent., so that the cost per mile for the materials necessary for maintenance can be set down as 0.29d. Similarly, with the cost of labour for maintenance. The pre-war Id. per mile had become 1.13d. by October, 1940, and is now about 1.15d.
We now come, to the difficult item of depreciation. The pre-war cost of a 7-8-tonner, less tyres, was probably about £800. Allowing 10 per cent, of that as residual value, that is, assuming that, when it was worn out, the operator obtained £80 for it, there is left £720 to be spread over 200,000 miles. That is equivalent to 0.88d. per mile as the net figure for depreciation. That applies, however, only if the vehicle be covering not less than 48,000 miles per annum.
If it be covering only 800 miles per week, or 40,000 miles per annum, that net figure must be increased, in order to allow for obsolescence. The increase is at the rate of .5 per cent, for every 2,000 miles by which the mileage falls short of 48,000 per annum. In this case the increase is 20 per cent., bringing the depreciation cost per mile up to 1.03d. That is the pre-war figure.
It is not easy to obtain accurate data concerning the ce-st ,ef new vehicles to-day. Each operator, applying this method, must use his own figures, if he has any. The information which I have shows that, from pre-war up to October, 1940, there was an increase of 40 per cent, in respect of a certain make, rising to 50 per cent, by the middle of last year. If I take those percentages as being representative, the depreciation cost per mile can be set down as 1.44d. in October, 1940, and 1.55d. to-day,