


The Fallacy of the Ton-mile
Page 47
Page 48
If you've noticed an error in this article please click here to report it so we can fix it.
I.N the issue of The Commercial Motor, dated January 17, I dealt with the depreciation and repair cost factor, and it is now the turn of service. Service is a wide term, and it might be advisable, first, to define my meaning of the word when applied to road transport. When applied to a unit, it refers to the general utility of the vehicle as well as. to the actual work done.
Consequently, allowance is made for:-(1) Time waiting in service, i.e., waiting to load or unload, as a standby for vehicles on the road, or waiting to can-y out a rush delivery, if required; (2) time loading; (3) time unloading; (4) time wasted by returning too early to the depot, yet too late to carry out another delivery; (5) time which, although not remunerative, is useful to the company.
All such time must be incurred in the operation of any commercial vehicle, but no allowance is made for it in the usual comparative factor. A further weakness in such items is that no allowance is made for the manner in which the work has been executed-for example, the ton-mile factor.
Vehicles A and B, each carrying a full load of 8 tons, leave the depot (D) to delivergoods at Z some 25 miles distant, Whereas A is delivering the full 8 tons at Z, B has two intermediate deliveries to make at X and V, respectively 5 miles and 10 miles distant from the depot, but along the same route, and has to unload 2 tons at X, 2 tons at and 4 tons at Z, thus:
Now let us assume the case of an over-zealous overseer who, wishing to show excellent returns on the ton-mile basis, instructs the driver of lorry B to deliver first at Z, unloading at 1( and X on his return trip, thus:
In each case equal service ihas been given, yet the tonmileage basis shows vehicle B (1) to have worked 30 per cent, less than A, although, of necessity, B (1) must have taken a little more time to do the trip. Comparing B (1) with B (2), however, the absurdity is even more marked, for the difference in time is negligible, the same distance has been run and the same tonnage delivered, yet the ton-mileage rate shows B (2) to have "worked" 65 per cent. more than B (1), whereas in reality. B (2) has run five miles light as compared with 25 Miles light by
B (1).
Which method of routing is the better-that of B (1) or
B (2)-is open to debate, because against running light we have the argument that the vehicle will be travelling faster and be subjected to "bouncing," with consequent uncalculated stresses on the chassis, tyres, etc., and possible heavy repairs at some future date. For the loaded vehicle it may be said that, provided the vehicle be loaded safely within the manufacturer's expectations, it will be subjected only to those stresses which have been fully anticipated. The additional cost will, therefore, be slight, and confined to petrol and oil.
Vehiole.
B
ci If 8tdd.
256 318 366 197 480 246 877 1,004
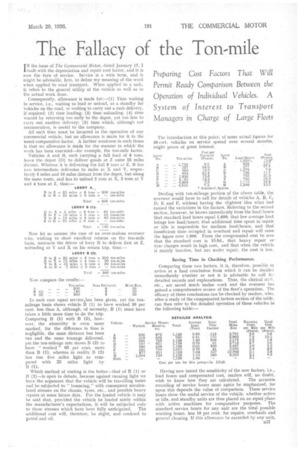
The introduction at this point, of some actual figures for 30-cwt. vehicles on service spread over several months, might prove of great interest Dealing with ton-mileage portion of the above table, the overseer would have to call for details of vehicles A, B, C, D, E and F, without having the slightest idea what had caused the variations in the factors. Referring to the second section, however, he knows immediately from the load/hours that standard load hours equal 1,600; that low average load brings low load/hours; that additional time spent in repair or idle is responsible for medium load/hours, and that insufficient time occupied in overhaul and repair will raise the figure over 1,600. From the compensated cost he sees that the standard cost is 15.8d., that heavy repair or tyre charges result in high cost, and that when the vehicle is mainly inactive, but not under 'repair, the cost is low.
Saving Time in Checking Performance.
Comparing these two factors, it is, therefore, possible to arrive at a final conclusion from which it can be decided immediately whether or not it is advisable to call fo: detailed records and explanations. Thus, the clerical stall, etc., are saved much undue work and the overseer has gained a comprehensive review of the fleet's operation. The efficacy of these conclusions can be checked by readers, who, after a study of the compensated factors section of the table, can then refer to the detailed operation of these vehicles in the following table:
Having now tested the sensitivity of the new factors, i.e., load hours and compensated cost, readers will, no doubt, wish to know how they are calculated. The accurate recording of service hours must again be emphasized, for upon this depends the value of comparison. These service hours show the useful service of the vehicle, whether active or idle, and standby units are thus placed on an equal plane with active machines for comparative purposes. The standard service hours for any unit are the total possible working hours, less 10 per cent, for repairs, overhauls and general cleaning. If this allowance be exceeded by any unit, B37 naturally that circumstance will affect the. service hours and show up in the final factor.
It is now necessary to consider the efficiency of any unit as regards capacity, to know whether the full capacity of the vehicle is being used or whether a smaller unit would suffice, the service hours of each vehicle are, therefore, multiplied by the average load per trip, giving the final -factor load/hours, which, it will be appreciated, must give a true index of service and efficiency of any vehicle. Dealing now with the cost aspect, it is again necessary to place all vehicles on the same plane if fair comparison is to be made. With this point in mind, it is necessary to take out all variable fixed charges. In this category, depreciation is immediately discarded, followed by garage rent, which varies according to district, etc. Accuracy of allocation is essential, particularly in the case of wages, which, of course, will be lower for a standby unit than for an active unit. .
Further Compensation. .
Having thus brought the costs into line, it is necessary to compensate further, for some units will run a considerable distance per service hour, whilst others will cover only short distances. If this distance be multiplied by the average running cost per mile, i.e., fuel, lubricants, tyres and maintenance [The Commercial Motor practice is to include depreciation as a running cost.—En.] the calculation will give the average running cost per service hour. This result must be deducted from the total cost per service hour, thus giving the final compensated cost per load/hour. For this average running cost, it is recommended that the figure be taken from The Commercial Motor Tables of Operating Costs. In the case of the 30-cwt. vehicles under review, the average running costs, excluding depreciation, are 2.Id. per mile. It will be apparent that any excess over this figure is left in the compensated cost and the unsatisfactory vehicles are immediately "shown up," all other costs, of course, being almost standard. From the above explanation it may appear that the calculation of the factors is somewhat involved, but this is not so in practice, as will be seen from the following detailed examples:— Standard:—
Total possible hours ... 1,248 Less 10 per cent. allowance for maintenance, etc. ... ... 124 Total service hours 1,124
• Standard pay-load, 1.41 ton: Standard pay-load/hours, 1,124 X 1.41 = 1,584.8, say, 1,600 load/hours. • Standard Charges.—Licences, wages, insurance, DNs running cost for . 1 mile (2.1d.) = 15.8(1. per mile per load/hour.
Total service hours 1,128,
Average load ner trip 0.-85 ton
Total load/hours 1,128 x 0.85 = 959 load/hours Total operating cost, less depreclation and garage £66 10s; 'Iota] cost per load/hour ............... .......... .... R66 /Os. • 16.64d.: 959 Average miles per service hour 2.4 1.4 over standard Average cost per "CM." Tables 2.1d. per mile Compensation .... . . ... . .............. 1.4 miles x 2.1d. = 2.94d. Compensated cost per load/hour '6.64d. less 2.94d. = 13.71.'
In the case of passenger vehicles, the average load is the number of passengers carried per trip, thus:—Total cost per complete journey, Is. -(or 2s. per round trip); total amount taken on round trip, 89s. 6d.; average number of passengers
89.5 per journey — = 44.75.
2.
The preparation of these factors is simple and takes up little time, yet they are extremely sensitive, and these, combined with the cumulative cost factor previously described, will form a picture adequate for the needs of the most exacting of supervisors.