


Lessons to Learn by Comparir Estimated and Actual Costs
Page 20
Page 21
Page 22
If you've noticed an error in this article please click here to report it so we can fix it.
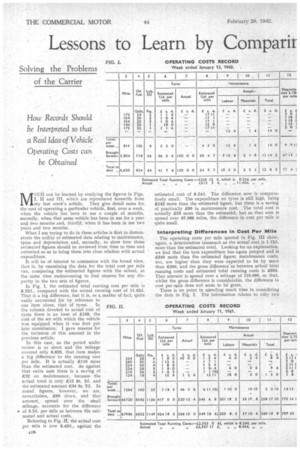
MUCH can be learned by studying the figures in Figs. I, II and III, which are reproduced herewith from my last week's article. They give detail sums for. the cost of operating a particular vehicle, first, over a week, when the vehicle has been in use a couple of months, secondly, when that same vehicle has been in use for a year. and two mouths and, tinnily, when it has been in use two years and two months.
What I am trying to do in these articles is first to demonstrate the utility of estimated data relating to maintenance, tyres and depreciation and, secondly, to show how those estimated figures should be reviewed from time to time and corrected so as to bring them into close relation with actual expenditure.
It will be of interest to commence with the broad view, that is,by examining the data for the total cost per Mile
run, . comparing the estimated figures with the actual, at the same time endeavouring to find reasons 'for any disparity in the two sets of figures.
In Fig, I, the estimated total running cost per mile is 8.22c1., compared with the actual running cost of 11.42d. That is a big difference, but it is, as a matter of fact, quite
easily accounted for by reference to ' one item alone, that of tyres. In the column devoted to actual cost of tyres there is an item of £150, the cost of the set with which the vehicle was equipped when it was first put into commission. I gave reasons for the inclusion of this amount in the previous article.
In this case, as the period under review is so short and the mileage covered only 6,620, that item makes a big difference to the running cost per mile. It is actually £110 more than the estimated cost. As against that extra sum there is a saving of £22 on maintenance, • because the actual total is only £12 8s. 2d. and the estimated amount £34 9s. 7d. In round figures, however, we are, nevertheless, £90 down, and that amount, spread over the sinall mileage, accounts for the difference • of 9.2d. per mile as between the estimated and actual costs.
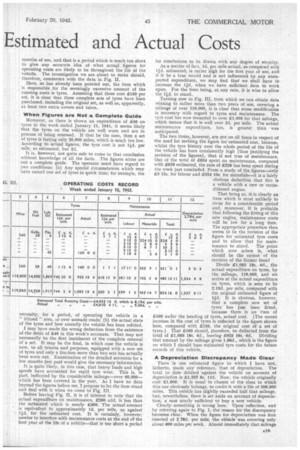
Referring to Fig. II, the actual cost per mile is now 8.43d., against the estimated cost of 8.24d. The difference now is comparatively small. The expenditure on tyres is still high, being £142 more than the estimated figure, but there is a saving of practically £90 in maintenance cost. The total cost is actually £53 more than the estimated, but as that sum is spread over 67,986 miles, the difference in cost per mile is quite small.
Interpreting Differences in Cost Per Mile
The operating costs per mile quoted in Fig. III show, again, a deterioration inasmuch as the actual cost is 1.12d. more than the estimated total. Looking for an explanation, we find that the tyre expenditure has again jumped and is £340 more than the estimated figure; maintenance costs, too, are higher than they were expected to be by more than £200, and the gross difference' as between actual total running costs and estimated total running costs is £555. That amount is spread over a mileage of 119,060, so that, whilst the gross difference is considerable, the difference in cost per mile does not seem to be great.
There is no point in spending much time in considering the data in Fig. I. The information relates to only two months of use, and that is a period which is much too short to give any accurate idea of what actual figures for operating costs are likely to be throughout the life Of the vehicle. The investigation we areabout to make should, therefore, commence with the data in Fig, II.
Here, as has already been pointed out, the item which is responsible for the seemingly excessive amount of the • running costs is tyres. Assuming that these cost £150 per set, it is clear that three complete sets of tyres have been purchased. including the original set, as well as; apparently, at least two extra covers and tubes.
When Figures are Not a. Complete Guide Moreover, as there is shown an expenditure of £46 on tyres in the week ended January 11, 1941, it seems likely that the tyres on the vehicle are well worn and are in process of being renewed. If that be the case, then a set of tyres is lasting only 20,000 miles, which is much too low. According to actual figures, the tyre cost, is not lid. per mile, as estimated, but 2d.
It is, however, not quite safe to come to that conclusion without knowledge of all the facts. The figures alone are not a complete guide. The operator must have regard to two conditions: (a) Any special circumstances which may have ruined one set of tyres in quick time: for example, the necessity, for a period, of operating the vehicle in a " blitzed " area, or over unmade roads; (b) the actual state of the tyres and how recently the vehicle has been refitted.
I may have made the wrong deduction from the existence of the debit of £46 in this week's accounts. That may not necessarily be the first instalment of the complete renewal of a set. It may be the final, in which case the vehicle is now, to all intents and purposes, equipped with a new set of tyres and only a fraction more than two sets has actually been worn out. Examination of the detailed accounts for a few months just past would give the necessary information.
It is quite likely, in this case, that heavy loads and high speeds have accounted for rapid tyre wear. This is, in part, indicated by the considerable mileage—over 60,000— which has been covered in the year. As I have no data beyond the figures before me, I propose to let the item stand and deal with it when we come to Fig, III, Before leaving Fig. IL it is of interest to note that the actual expenditure on maintenance, £260 odd, is less than the estimated which is nearly £350. The actual amount is equivalent to approximately Id. per mile, as against 1 id. for the estimated cost. It is certainly, however, unwise to interfere with maintenance costs at the end of the first year of the life of a vehicle—that is too short a period
for conclusions to be drawn with any degree of security. As a matter of fact, Id. per mile actual, as compared_ with fl d. estimated; is rather high for the first year of use, and if it be a true record and is not influenced by any unexpected expenditure, we may find that we shall have to increase the lid. when we have sufficient data to work upon. For the time being, at any rate, it is wise to allow the lid. to stand.
Turning now to Fig. III, from which we can obtain data relating to rather more than' two years of use, covering a mileage of over 119,000, it is clear that some modification is necessary with regard to tyres and maintenance. The Lyre cost has now mounted to over £1,000 for that mileage, which means that it is well over 2d. per mile. The actual maintenance expenditure, too, is greater than was anticipated.
The. two items,, however, are not on all fours in respect of the need for revising the figure for estimated cost, because, whilst the tyre history over the whole period of the life of the vehicle has been consistently high (thus justifying the revision of the figures), that is not true of maintenance. Out of the total of £834 spent on maintenance, compared with £620 estimated, the sum of £328 has been spent during the week just concluded. From a study of the figures—only £3 15s. for 'labour and £324 10s, for materials—it is a fairly obvious deduction that this is a vehicle with a new or reconditioned engine.
That being so, it is clearly an item which is most unlikely to recur for a considerable period and, moreover, it is probable that following the fitting of this new engine, maintenance costs will be low for a long time. The appropriate procedure then seems to be the revision of the figure for estimated tyre costs and to allow that for maintenance to stand. The point which now arises is, •what should be the extent of the revision of the former item?
Divide £1,083 18s. 6d., the actual expenditure on tyres, by the mileage, 119,060, and we arrive at the actual expenditure on tyres, which is seen to be 2.19d. per mile, compared with the original estimated figure of lid. It is obvious, however, that a complete new set of tyres has just been fitted, because there is an item of £160 under the heading of tyres, actual cost. (The recent increase in the cost of tyres is reflected in the figure shown here, compared with £150, the original cost of a set of tyres.) • That £160 should, therefore, be deducted from the total of £1,083 18s. 6d., leaving £923 I8s. 6d. Dividing that amount by the mileage gives 1.86d., which is the figure on which I should base estimated tyre costs for the future records of this vehicle.
1 351 -, 0 1 3 0 3 6 483 15 11 1,334 8 8
7 834 16 0 1,337
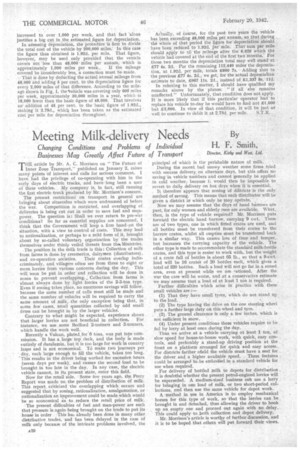
811 A Depreciation Discrepancy Made Clear There is one estimated figure to which I have not, hitherto, made anyreference, that of depreciation. The total to date debited against the vehicle on account of depreciation is £1,337 8s. lid. Now, the vehicle originally cost £1,600. It is usual in chassis of the class to which this one obviously belongs, to credit it with a life of 200,000 miles. This vehicle has slightly exceeded half that mileage, but, nevertheless, there is set aside on account of depreciation, a surd nearly sufficient to buy a new vehicle. Clearlysomething is wrong here. Upon reflection, and by referring again to Fig. I, the reason for the discrepancy becomes clear; When the figure for depreciation was first inserted at 2.78d. per mile, the vehicle was covering only about 600 miles per week. Almdst immediately that mileage
increased to over 1,000 per week, and that fact 'alone justifies a big cut in the estimated figure for depreciation.
In aSSessing depreciation, the procedure is first to divide the total cost of the vehicle by 200,000 miles. In this case the figure thus obtained is 1.92d. per mile. That figure, however, may be used only provided that the vehicle covers not less than 48,000 miles per annum, which is approximately 1,000 miles per week.. If the mileage covered be COnsiderably less, a correction must be made.
That is done by deducting the actual annual mileage from 48,000 and adding 5 per cent, to the depreciation figure for ever,' 2,000 miles of that 'difference. According to the mileage shown in Fig, I, the 'Vehicle was covering only 600 miles per week, approximately 30,000 miles in a year, which -is 18,000 fewer than the basic figure of 48,000. That involves an' • addition of 45. per cent, to the 'basic figure of 1.92d., making it 2.78d., whicla has been taken as the estimated cost per mile for depreciation throughout. Actually, of Course, for the past two years the vehicle has been exceeding .48,006 miles per annum, co that during the whole of that period the figure for depreciation should have been rechiced to 1.92d. per mile. That sum per mile should apply to 'all the mileage after the 6,620 which the vehicle had covered at the end of the first two Months. For those.two months the depreciation total may well stand at £77 4s. 2d. • For the remaining 112,440 miles the depreciation, at 1.92d. per mile, totals £890 7s. -Adding that to the previous £77 4s. 2d., we get, for the actual depreciation estimate -todate, £967 us. 2d_, instead 'of £1,337 8s.Ild.
In referring to this matter, I should have qualified my remarks. above by the phrase: " if all else remains unaffected." Unfortunately, that condition does not apply. It is more likely that if this particular operator had to replace his vehicle to-day he would have to find-not £1,600 but £3,000. In view of that condition, it will be justas well to continue to debit it at 2.78d. per mile. . S.T.R.