 1
1 2
2 3
3 4
4 5
5 6
6 7
7 8
8 9
9 10
10 11
11 12
12 13
13 14
14 15
15 16
16 17
17 18
18 19
19 20
20 21
21 22
22 23
23 24
24 25
25 26
26 27
27 28
28 29
29 30
30 31
31 32
32 33
33 34
34 35
35 36
36 37
37 38
38 39
39 40
40 41
41 42
42 43
43 44
44 45
45 46
46 47
47 48
48 49
49 50
50 51
51 52
52 53
53 54
54 55
55 56
56 57
57 58
58 59
59 60
60 61
61 62
62 63
63 64
64 65
65 66
66 67
67 68
68 69
69 70
70 71
71 72
72 73
73 74
74 75
75 76
76 77
77 78
78 79
79 80
80 81
81 82
82 83
83 84
84 85
85 86
86 87
87 88
88 89
89 90
90 91
91 92
92 93
93 94
94 95
95 96
96 97
97 98
98 99
99 100
100 101
101 102
102 103
103 104
104 105
105 106
106 107
107 108
108 109
109 110
110 111
111 112
112 113
113 114
114 115
115 116
116 117
117 118
118 119
119 120
120 121
121 122
122 123
123 124
124 125
125 126
126 127
127 128
128 129
129 130
130 131
131 132
132 133
133 134
134 135
135 136
136 137
137 138
138 139
139 140
140 141
141 142
142 143
143 144
144 145
145 146
146 147
147 148
148 149
149 150
150 151
151 152
152 153
153 154
154 155
155 156
156 157
157 158
158 159
159 160
160 161
161 162
162 163
163 164
164 165
165 166
166 167
167 168
168 169
169 170
170 171
171 172
172 173
173 174
174 175
175 176
176 177
177 178
178 179
179 180
180 181
181 182
182 183
183 184
184 185
185 186
186 S PR E A D 'EM
Page 48
Page 49
Page 50
Page 51
If you've noticed an error in this article please click here to report it so we can fix it.
A head for figures is handy when you are analysing fleet
efficiency — so is a
decent spreadsheet that does the sums for you. And that's what Freight Best Practice has created.
Best of all, it's free.
Robin Nimes gives the low-down.
When Freight Best Practice came up with its Small Fleet Performance Management Tool a couple of years ago, we couldn't rate it highly enough.And that's also the case with the new Fleet Performance Management Tool which, as you might guess from the name, is an upgrade of the original product but for fleets that are a bit... bigger.
As with its predecessor, the Fleet Performance Management Tool is essentially just a spreadsheet into which you plug all your key fleet data, and out of which you extract a series of reports on your productivity and efficiency.
To say it is 'just' a spreadsheet, however, is to undersell grossly both the amount of work that has gone into developing it and the amount of useful data it can provide.
Getting started
Once you have registered at the Freight Best Practice website,downloading the compressed Fleet Performance Management Tool is quick and easy Expanding! unzipping the program takes only a few seconds— the most time-consuming element is probably working out where on your hard drive you want to install it. It's also worth downloading the handy PDF manual, which offers a step-by-step guide.
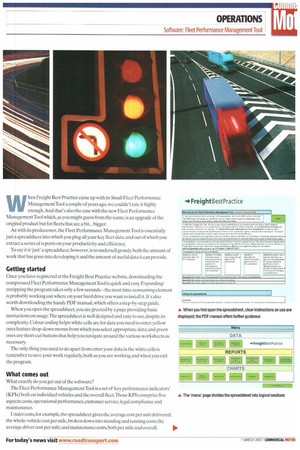
When you open the spreadsheet, you are greeted by a page providing basic instructions on usage.The spreadsheet is well designed and easy to use, despite its complexity. Colour coding helps: white cells are for data you need to enter; yellow ones feature drop-down menus from which you select appropriate data; and green ones are short-cut buttons that help you navigate around the various worksheets as necessary.
The only thing you need to do apart from enter your data in the white cells is remember to save your work regularly, both as you are working and when you exit the program.
What comes out
What exactly do you get out of the software?
Fleet Performance ManagementTool is a set of 'key performance indicators' (KPIs) both on individual vehicles and the overall Ileet.Those KPIs comprise five aspects: costs, operational performance, customer service, legal compliance and maintenance.
Under costs, for example, the spreadsheet gives the average cost per unit delivered; the whole-vehicle cost per mile, broken down into standing and running costs; the average driver cost per mile; and maintenance costs, both per mile and overall. Operational performance KPIs cover such aspects as fuel consumption per individual vehicle or as a fleet average; total miles run; empty mileage: vehicle fill against capacity; and vehicle working time against available time.
Customer service KPIs include the percentage of your deliveries that: are late; feature missing or damaged goods; or give rise to a complain t.Compliance KPIs boil down to the total number of: overloads; traffic infringements; drivers hours infringements; and traffic accidents in any given period.
Maintenance KPIs tell you the percentage of vehicle inspections that resulted in failure or were overdue, and the percentage of vehicle defects reported by drivers that were rectified within 24 hours.
Much of this information can be presented in weekly, monthly or annual summaries, and some is available in both statistical and graphical forms.
If you already have all these figures to hand, there is probably little reason to read on. Somehow, however, we suspect many readers will want to continue...
What goes in
To extract all the data, however,you must first enter comprehensive information on individual vehicles' weekly operations and costs. For a start, details of each vehicle in your fleet include: registration; make;gross vehicle weight; maximum payload; purchase price; date of entry into service; planned life; and some basic standing costs, such as road-fund licence and insurance.
After that, it is pretty much a case of updating the spreadsheet whenever a vehicle moves.That means inputting information weekly on such information as: odometer readings; working hours; payloads carried; fuel purchased; and any maintenance costs. Customer complaints and deliveries that involved missing or damaged goods must also he recorded. On top of that, you should also log what you have paid your drivers (or agency drivers) during the week.
At that point, it's on to the compliance data where you can record: the number of inspections; the results of those inspections during the week; how quickly any defects were resolved; any MoT failures or prohibitions; and the number of overloads, traffic infringements or accidents each vehicle has been involved in.
Entering all this information weekly for every vehicle on your fleet is going to take a fair amount of time, but you need only update the aspects that interest you.
Once you have completed a week's data, you are immediately in a position to start accessing the analysis reports. As you continue to use it over subsequent weeks, the analysis reports of your overall operation will become increasingly accurate.
Performance summary
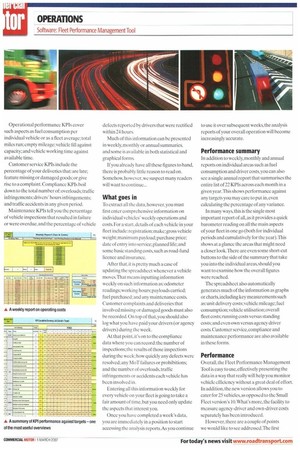
In addition to weekly, monthly and annual reports on individual areas such as fuel consumption and driver costs,you can also see a single annual report that summarises the entire list of 22 KPIs across each month in a given year.This shows performance against any targets you may care to put in, even calculating the percentage of any variance.
In many ways, this is the single most important report of all, as it provides a quick barometer reading on all the main aspects of your fleet in one go (both for individual periods and cumulatively for the year).This shows at a glance the areas that might need a closer look.There are even some short-cut buttons to the side of the summary that take you into the individual areas, should you want to examine how the overall figures were reached.
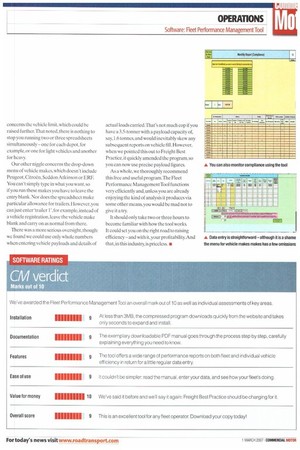
The spreadsheet also automatically generates much of the information as graphs or charts, including key measurements such as: unit delivery costs; vehicle mileage; fuel consumption;vehicle utilisation; overall fleet costs; running costs versus standing costs; and even own versus agency driver costs. Customer service, compliance and maintenance performance are also available in these forms.
Performance
Overall, the Fleet Performance Management Tool is easy to use, effectively presenting the data in a way that really will help you monitor vehicle efficiency without a great deal of effort. In addition, the new version allows you to cater for /5 vehicles, as opposed to the Small Fleet version's 10. What's more, the facility to measure agency-driver and own-driver costs separately has been introduced.
However, there are a couple of points we would like to see addressed.The first concerns the vehicle limit, which could be raised further.That noted, there is nothing to stop you running two or three spreadsheets simultaneously — one for each depot, for example, or one for light vehicles and another for heavy.
Our other niggle concerns the drop-down menu of vehicle makes, which doesn't include Peugeot, Citron, Seddon Atkinson or ERE You can't simply type in what you want, so if you run these makes you have to leave the entry blank. Nor does the spreadsheet make particular allowance for trailers. However, you can just enter 'trailer I ',for example, instead of a vehicle registration, leave the vehicle make blank and carry on as normal from there.
There was a more serious oversight, though: we found we could use only whole numbers when entering vehicle payloads and details of actual loads carried.That's not much cop if you have a 3.5-tonner with a payload capacity of, say, 1.6 tonnes, and would inevitably skew any subsequent reports on vehicle fill. However, when we pointed this out to Freight Best Practice, it quickly amended the program, so you can now use precise payload figures.
As a whole, we thoroughly recommend this free and useful program.The Fleet Performance Management Tool functions very efficiently and, unless you are already enjoying the kind of analysis it produces via some other means, you would be mad not to give it a try.
It should only take two or three hours to become familiar with how the tool works. It could set you on the right road to raising efficiency —and with it, your prolitability.And that,in this industry, is priceless. •