


Bus Profits Drop
Page 42
Page 43
If you've noticed an error in this article please click here to report it so we can fix it.
Annual Reports of the Licensing Authorities Show a Further Decline of £2,396000 in Net Receipts of Passenger Transport Operators
ASTORY of rising costs and diminishing net revenue is told in the Annual Reports of the Licensing Authorities for Public Service Vehicles, 1949-1950, which have just been published as a Blue book by the Stationery Office at 2s. They cover the period to March 31, 1950. Although they are not up to date, they indicate a trend which has been accentuated since the period under review.
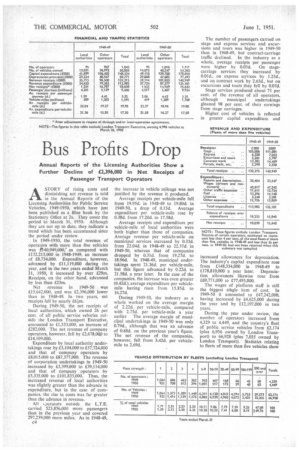
In 1949-1950, the total revenue of operators with more than live vehicles was e140,949,000,' as compared with £132,215,000 in 1948-1949, an increase of £8,734.000. Expenditure, however, advanced by £11,119,000 during the year, and in the two years ended March 31, 1950, it increased by over £29m. Receipts, on the other hand, advanced by less than £23m.
Net revenue in 1949-50 was £15,642,000. and was £2,396,000 lower than in 1948-49. In two years, net receipts fell by nearly £61m.
During 1949-50, the net receipts of local authorities, which owned 26 per cent. of all public service vehicles outside the London Transport Executive, amounted to £1.533,000, an increase of £282,000. The net revenue of company operators, however, fell by £2,678,000 to £14.109,000.
Expenditure by local authority undertakings rose by £3,104,000 to £37,724,000 and that of company operators by £8,015,000 to £87,377,000. The revenue of corporation undertakings in 1949-50 increased by £3,399,000 to £39,114,000 and that of Company operators by £5,335,000 to £101,835,000. Thus, the increased revenue Of local authorities was slightly greater than the advance in expenditure, but in the case of companies, the rise in costs was far greater than the advance in revenue.
All t-perators outside the L.T.E. carried 523,856,000 more passengers than in the previous year and covered 297,239,000 more miles. As in 1948-49, c4 the increase in vehicle mileage was not justified by the revenue it produced.
Average receipts per vehicle-mile fell from I9.95d. in 1948-49 to 19.80d. in 1949-50, a drop of 0.15d. Average expenditure per vehicle-mile rose by 0.38d. from 17.20d. to 17.58d.
Average receipts and expenditure per vehicle-mile of local authorities were both higher than those of companies. Average revenue per vehicle-mile on municipal services increased by 0.33d. from 22.04d. in 1948-49 to 22.37d. in 1949-50, whereas that of companies dropped by 0.3 Id. from 19.27d. to 18.96d. In 1948-49, municipal undertakings spent 21.36d. per vehicle-mile, but this figure advanced by 0.22d. to 21.58d. a year later. In the case of the companies, the increase was even greater (0.42d.), average expenditure per vehiclemile having risen from I5.85d. to 16.27d.
During 1949-50, the industry as a whole worked on the average margin of 2.22d. per vehicle-mile, compared with 2.75d. per vehicle-mile a year earlier The average margin of municipal undertakings in 1949-50 was only 0.79d., although that was an advance of 0.68d. on the previous year's figure. The net revenue of the companies, however, fell from 3.42d. per vehiclemile to 2.69d. The number of passengers carried on stage and express services and excursions and tours was higher in 1949-50 than in 1948-49, but contract-carriage traffic declined. In the industry as a whole, average receipts per passenger were higher by 0.03d. On stagecarriage services they increased by 0.0Id., on express services by .1.25d., and on Contract work by 2.65d., but on excursions and tours they fell by 0.07d.
Stage services produced about 71 per cent, of the revenue of all operators, although municipal undertakings gleaned 98 per cent. of their earnings from stage carriages.
Higher cost of vehicles is reflected in greater capital expenditure and increased allowances for depreciation_ The industry's capital expenditure rose from £148,334,000 in 1948-49 to £178,810,000 a year later. Depreciation allowances likewise rose from £69,771,000 to £77,493,000.
The wages of platform staff is still the biggest single item of cost. In 1949-50 it amounted to £47,242,000, having increased by £4,625,000 during the year and by £12,197,000 in two years.
During the year under review, the number of operators increased from 4,329 to 4,449, and the country's fleet of public service vehicles from 62,174 (plus 6,936 owned by London Transport) to 66,928 (plus 7,035 owned by London Transport). Statistics relating to fleets of more than five vehicles show hat 95 municipal undertakings owned 14,015 public service vehicles, and 1,016 companies, 40,247 vehicles.
Nearly 50 per cent, of all public ;ervice vehicles, excluding those owned sy London Transport, are to be found n fleets of 200 and over. More than 18 per cent are represented by fleets ranging from one to nine vehicles.
The reports show that during the year under review, only two decisions of the Licensing Authorities were reversed on appeal, whereas 103 were apheld. Several of the Licensing Authorities refer to the large number of applications for the variation of road-service licences, to the growing use of doubledeckers and to the growth of excursions and tours. In the Eastern Area there was a noticeable decline in private-party work.
Referring to the improvement of facilities, the Northern Licensing Authority says that "many operators have shown commendable initiative in breaking new ground."
The Metropolitan Licensing Author
ity says that congestion in Central London was aggravated by parking in the streets by contract carriages, over the movement of which he had no control.
The Licensing Authorities refer to developments in plans to provide bus stations. They also say that there has been a general improvement in the standard of vehicle maintenance. They are, however, not satisfied that all operators take sufficient precautions to ensure that the law relating to drivers' hours is observed.