


WHAT'S A DRIVER WORTH?
Page 32
Page 33
Page 34
If you've noticed an error in this article please click here to report it so we can fix it.
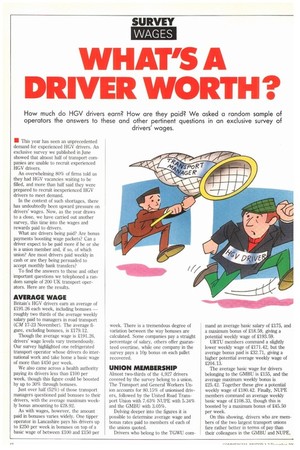
How much do HGV drivers earn? How are they paid? We asked a random sample of operators the answers to these and other pertinent questions in an exclusive survey of drivers' wages.
• This year has seen an unprecedented demand for experienced HGV drivers. An exclusive survey we published in June showed that almost half of transport companies are unable to recruit experienced HGV drivers.
An overwhelming 80% of firms told us they had HGV vacancies waiting to be filled, and more than half said they were prepared to recruit inexperienced HGV drivers to meet demand.
In the context of such shortages, there has undoubtedly been upward pressure on drivers' wages. Now, as the year draws to a close, we have carried out another survey, this time into the wages and rewards paid to drivers.
What are drivers being paid? Are bonus payments boosting wage packets? Can a driver expect to be paid more if he or she is a union member and, if so, of which union? Are most drivers paid weekly in cash or are they being persuaded to accept monthly bank transfers?
To find the answers to these and other important questions we telephoned a random sample of 200 UK transport operators. Here are the results.
AVERAGE WAGE
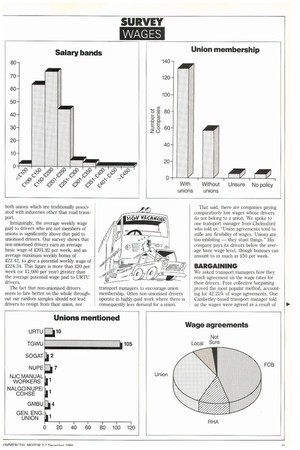
Britain's HGV drivers earn an average of £191.26 each week, including bonuses — roughly two thirds of the average weekly salary paid to managers in road transport (CM 17-23 November). The average figure, excluding bonuses, is 2179.12.
Though the average wage is £191.26, drivers' wage levels vary tremendously. Our survey highlighted one refrigerated transport operator whose drivers do international work and take home a basic wage of more than £450 per week.
We also came across a health authority paying its drivers less than 2100 per week, though this figure could be boosted by up to 30% through bonuses.
Just over half (52%) of those transport managers questioned paid bonuses to their drivers, with the average maximum weekly bonus amounting to £28.92.
As with wages, however, the amount paid in bonuses varies widely. One tipper operator in Lancashire pays his drivers up to £250 per week in bonuses on top of a basic wage of between 2100 and 2150 per
week. There is a tremendous degree of variation between the way bonuses are calculated. Some companies pay a straight percentage of salary, others offer guaranteed overtime, while one company in the survey pays a 10p bonus on each pallet recovered.
UNION MEMBERSHIP
Almost two-thirds of the 4,927 drivers covered by the survey belong to a union. The Transport and General Workers Union accounts for 80.15% of unionised drivers, followed by the United Road Transport Union with 7.63% NUPE with 5.34% and the GMBU with 3.05%.
Delving deeper into the figures it is possible to determine average wage and bonus rates paid to members of each of the unions quoted.
Drivers who belong to the TGWU corn mand an average basic salary of £175, and a maximum bonus of 218.59, giving a potential weekly wage of £193.59.
URTU members command a slightly lower weekly wage of £171.42, but the average bonus paid is £32.71, giving a higher potential average weekly wage of £204.13.
The average basic wage for drivers belonging to the GMBU is £155, and the average maximum weekly bonus is £25.42. Together these give a potential weekly wage of £180.42. Finally, NUPE members command an average weekly basic wage of £108.33, though this is boosted by a maximum bonus of £45.50 per week.
On this showing, drivers who are members of the two largest transport unions fare rather better in terms of pay than their colleagues in the GMBU and NUPE, both unions which are traditionally associated with industries other than road transport.
Intriguingly, the average weekly wage paid to drivers who are not members of unions is significantly above that paid to unionised drivers. Our survey shows that non-unionised drivers earn an average basic wage of £201.92 per week, and an average maximum weekly bonus of 222.42, to give a potential weekly wage of £224.34. This figure is more than £20 per week (or £1,000 per year) greater than the average potential wage paid to URTU drivers.
The fact that non-unionised drivers seem to fare better on the whole throughout our random samples should not lead drivers to resign from their union, nor transport managers to encourage union membership. Often non-unionised drivers operate in highly-paid work where there is consequently less demand for a union. That said, there are companies paying comparatively low wages whose drivers do not belong to a union. We spoke to one transport manager from Chelmsford who told us: "Union agreements tend to stifle any flexibility of wages. Unions are too inhibiting — they stunt things." His company pays its drivers below the average basic wage level, though bonuses can amount to as much as £50 per week.
BARGAINING
We asked transport managers how they reach agreement on the wage rates for their drivers. Free collective bargaining proved the most popular method, accounting for 42.21% of wage agreements. One Camberley-based transport manager told us the wages were agreed as a result of free collective bargaining, but added: The drivers are told what they'll be paid."
A Colchester operator said: "Free col lective bargaining call it what you like, we pay well in excess of the union rate."
A further 27.64% of transport managers asked told us their drivers were paid according to union-agreed rates, while 16.58% said their agreements were guided by the Road Haulage Association. An Evesham operator told us: "We use the RHA rate as a guide and pay just above."
PAYMENTS
It is a strongly-held tradition in this industry that drivers are paid in cash each Friday and, much as banks and employers try to change drivers' ways, that pattern persists.
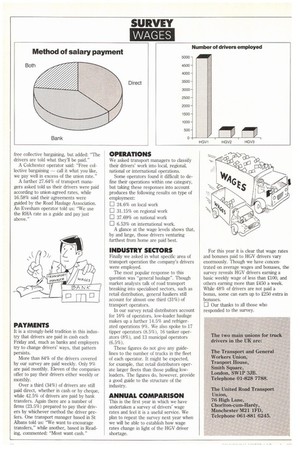
More than 84% of the drivers covered by our survey are paid weekly. Only 9% are paid monthly. Eleven of the companies offer to pay their drivers either weekly or monthly.
Over a third (34%) of drivers are still paid direct, whether in cash or by cheque, while 42.5% of drivers are paid by bank transfers. Again there are a number of firms (23.5%) prepared to pay their drivers by whichever method the driver prefers. One transport manager based in St Albans told us: "We want to encourage transfers," while another, based in Reading, commented: "Most want cash."
OPERATIONS
We asked transport managers to classify their drivers' work into local, regional, national or international operations.
Some operators found it difficult to define their operations within one category, but taking these responses into account produces the following results on type of employment:
LI 24.6% on local work
O 31.15% on regional work O 37.69% on national work O 6.53% on international work. A glance at the wage levels shows that, by and large, those drivers venturing furthest from home are paid best.
INDUSTRY SECTORS
Finally we asked in what specific area of transport operation the company's drivers were employed.
The most popular response to this question was "general haulage". Though market analysts talk of road transport breaking into specialised sectors, such as retail distribution, general hauliers still account for almost one third (31%) of transport operators.
In our survey retail distributors account for 16% of operators, low-loader haulage makes up a further 14.5% and refrigerated operations 9%. We also spoke to 17 tipper operators (8.5%), 16 tanker operators (8%), and 13 municipal operators (6.5%).
These figures do not give any guidelines to the number of trucks in the fleet of each operator. It might be expected, for example, that retail distributors operate larger fleets than those pulling lowloaders. The figures do, however, provide a good guide to the structure of the industry.
ANNUAL COMPARISON
This is the first year in which we have undertaken a survey of drivers' wage rates and feel it is a useful service. We plan to repeat the survey next year when we will be able to establish how wage rates change in light of the HGV driver shortage. For this year it is clear that wage rates and bonuses paid to HGV drivers vary enormously. Though we have concentrated on average wages and bonuses, the survey reveals HGV drivers earning a basic weekly wage of less than 2100, and others earning more than £450 a week. While 48% of drivers are not paid a bonus, some can earn up to 2250 extra in bonuses.
0 Our thanks to all those who responded to the survey.