The transport equation
Page 68

Page 69

Page 70

Page 71

If you've noticed an error in this article please click here to report it so we can fix it.
by R. Ellis
British Leyland Truck and Bus Group ELLIS opened his paper examining the basic trans. equation of supply and and and demonstrating the ast infinite number of cle design variables which .id be brought into play if y operator were able to :ify his own individual ce on even the basic cornants such as cab, engine, smission and suspension. also stressed that, while large fleet operator was a erful influence, the small qator was not only an artant contributor to the anal economy but collecly a significant element in overall demand for trucks.
duct concept
fter discussing the principal iences on design, such as type of freight, the operatenvironment and the ands for reliability, duray and performance, and nining the influence of a, the paper continued : le product concept is inigated in depth, starting its basic elements and Tessing to the completed , with static and dynamic testing followed by perlance and durability testof the complete structure both rigs and prototype des. The feed back/feed rard system is used, with rmation from the physical ng of the product fed back esign, who change specifims and features accord,' and then propose modisolutions for further testAs the product reaches ar to its objectives, the rrtunity is taken to incor.te some of its features vehicles for testing under line operating conditions, ultimately complete vehiare despatched to overseas tories and to operators in country for final proving re the decision to launch production is taken.
Iroughout, careful liaison . production engineers is ntial to ensure that the .uction process reproduces characteristics which the gners require without deent to required production ets. Production sub-assent blies and pilot production vehicles require further testing and audit to ensure the validity of the final product, and relating these results to the performance of material produced from production tools is one of the most critical parts of the whole process.
It is in this area that errors are most likely to occur in the engineering process. Transport operators frequently express the view that more effort put into genuine operational testing over long periods would 'eliminate the margin of risk but in developing products for high-volume production so that demand can be satisfied and cost kept to reasonable levels the engineer is faced with an almost insoluble problem.
If production facility for a new engine costs E15m and takes two years to install, it is patently not commercially feasible to make that investment, produce a batch of say, one hundred units off the production tools, put them into service for one and a half years for proving, then go back to modify tools and designs and start the whole process again. In such a process the manufacturer would have to continue production of the type to be replaced in the old facility, whilst paying interest charges on the new facility, which would have to lie idle for at least a year and possibly longer. Almost invariably, therefore, there is no practical alternative to testing prototypes using the method described but, following less than satisfactory experiences by many manufacturers when early moves to volume production were made, a considerable amount of effort has been devoted to devising techniques which can ensure a close correlation between prototype test results and the predicted performance of the product from production tools.
In this respect, a post-production analysis and review process is of paramount importance, the ability to identify the cause of abnormal results and modify rapidly is critical to ensuring the success of a new product. A very important part of the development process is thus the continued involvement of the original engineering team until the product is well into production and achieving the performance results planned for it.
Response to operators' needs
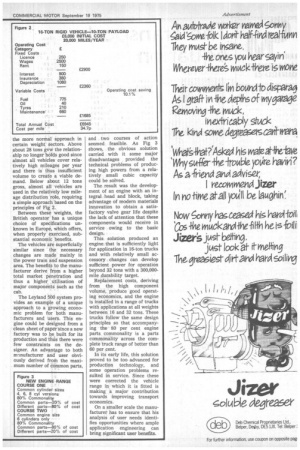
As indicated, economics in both broad and detailed senses are a primary influence in dictating the engineering mix in the transport problem solution. A typical 16-ton rigid, carrying a payload of ten tons, may have annual costs similar to those in Fig. 1. When used for 40,000 miles per year, over 65 per cent of this cost is directly influenced by the designer, since it is either running cost or cost related to the price of the vehicle. The actual cost per mile is 23.8 pence and the vehicle will be replaced after five years and 200,000 miles.
A large number of 10-tonpayload vehicles cover significantly less than 40,000 miles per year on urban distribution and similar duties. For these vehicles 20,000 miles may be as much as is required, but replacement will still need to take place at about the same period since an up-to-date fleet is important to the image of most users and development trends offer potential efficiency improvements which need to be obtained.
In this common case the cost per mile rises from 23.8 pence to 38.6 pence, with pricerelated elements rising to 34.2 per cent of the total. 38.6 pence per mile is an uneconomic rate, but if the concept of the vehicle design is altered to take account of the lower lifetime mileage before replacement or major overhaul becomes necessary, a significant improvement can be made.
Fig 2 shows how a lower level of durability, without affecting reliability in terms of failures per year, can improve the cost per mile on the distri bution vehicles by 10.1 per cent or over £700 per year. A lower overall maintenance charge is possible through lower-cost spares and less complexity.
There is, though, a need for premium duty engineering and the more normal approach in certain weight sectors. Above about 28 tons gvw the relationship no longer holds good since almost all vehicles cover relatively high mileages per year and there is thus insufficient volume to create a viable demand. Below about 12 tons gross, almost all vehicles are used in the relatively low mileage distribution role, requiring a simple approach based on the principles of Fig 2.
Between these weights, the British operator has a unique choice of specifications unknown in Europe, which offers, when properly exercised, substantial economic benefits.
The vehicles are superficially similar since the necessary changes are made mainly in the power train and suspension area. The benefits to the rnanufacturer derive from a higher total market penetration and thus a higher utilisation of major components such as the cab.
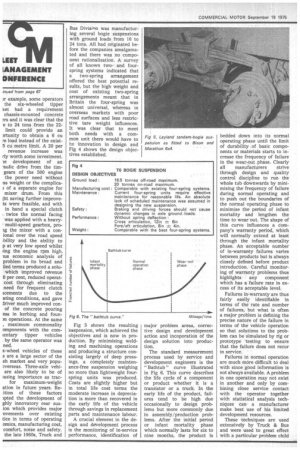
The Leyland 500 system provides an example of a unique approach to a growing economic problem for both manufacturers and users. This engine could be designed from a clean sheet of paper since a new factory was to be built for its production and thus there were few constraints on the designer. An advantage to both mlnufacturer and user obviously derived from the maximum number of common parts, and two courses of action seemed feasible. As Fig 3 shows, the obvious solution carried with it some major disadvantages provided the technical problems of producing high powers from a relatively small cubic capacity could be solved.
The result was the development of an engine with an integral head and block, taking advantage of modern materials innovation to obtain a satisfactory valve gear life despite the lack of attention that these components would receive in service owing to the basic design.
This solution produced an engine that is sufficiently light for application in 16-ton trucks and with relatively small accessory changes can develop sufficient power for operation beyond 32 tons with a 300,000mile durability target.
Replacement costs, deriving from the high component volume, produce good operating economics, and the engine is installed in a range of trucks with applications at all weights between 16 and 32 tons. These trucks follow the same design principles so that accompanying the 80 per cent engine parts commonality is a parts commonality across the complete truck range of better than 60 per cent.
In its early life, this solution proved to be too advanced for production technology, and some operation problems resulted in service. Since these were corrected the vehicle range in which it is fitted is making a major contribution towards improving transport economics.
On a smaller scale the manufacturer has to ensure that his analysis of user needs identifies opportunities where ample application engineering can bring significant user benefits. n. example, some operators the six-wheeled tipper ket had a requirement chassis-mounted concrete :rs and it was clear that the • e to 24 tons from the 22limit could provide an rtunity to obtain a 6 Cu load instead of the exist5 Cu metre limit. A 20 per revenue increase was rly worth some investment. le development of an 'aulic drive from the titngears of the 500 engine the power need without ss weight or the complica3 of a separate engine for mixer drum. From this ;lit saving further improvets were feasible, and with in hand a special clutch • twice the normal facing was applied with a heavy' multi-speed gearbox, proig the mixer with a conional over the road speed bility and the ability to p at very low speed whilst oing the engine rpm high. ms economic analysis of problem in its broad and iled terms produced a soluwhich improved revenue 0 per cent, reduced operatcost through eliminating need for frequent clutch kcements due to the ating conditions, and gave iriver much improved conof the concrete pouring ess in kerbing and faunm operations. At the same , maximum commonality omponents with the cornientary tipper vehicles by the same operator was ned.
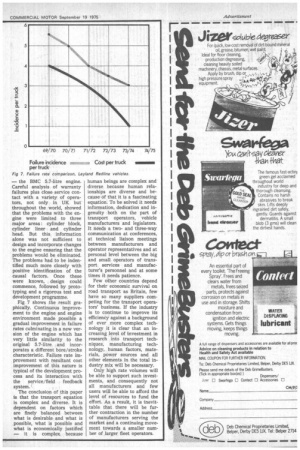
x-wheel vehicles of these s are a large sector of the sh market and very popuwerseas. Three-axle vehiare also likely to be of msing importance as trac for maximum-weight ation in future years. Reition of these factors ipted the development of ghly innovatory rear susion which provides major overnents over existing tice in terms of operating omics, manufacturing cost, comfort, noise and safety. the late 1960s, Truck and Bus Division was manufacturing several bogie suspensions with ground loads from 16 to 24 tons. All had originated before the companies amalgamated and there was no component rationalisation. A survey of all known two-. and fourspring systems indicated that a two-spring arrangement offered the best potential results, but the high weight and cost of existing two-spring arrangements meant that in Britain the four-spring was almost universal, whereas in overseas markets with poor road surfaces and less restrictive tare weight influences. It was clear that to meet both needs with a common unit there would have to be innovation in design and Fig 4 shows the design objectives established.
Fig 5 shows the resulting Suspension, which achieved the objectives and is now in production. By minimising welding and machining operations and producing a structure consisting largely of deep pressings, a completely maintenance-free suspension weighing no more than lightweight fourspring units was produced. Costs are slightly higher but in total life cost terms the moderate increase in depreciation is more than recovered in the early life of the vehicle through savings in replacement parts and maintenance labour.
A crucial element in the design and development process is the monitoring of in-service performance, identification of major problem areas, corrective design and development action and incoporation of the design solution into production.
The standard measurement process used by service and development engineers is the " Bathtub " curve illustrated in Fig 6. This curve describes the life cycle of a component or product whether it is a transistor or a truck. In the early life of the product, failures tend to be high due occasionally to design problems but more commonly due to assembly/production problems. After the initial period or infant mortality phase which normally lasts for six to nine months, the product is bedded down into its normal operating phase until the limit of durability of basic components or materials starts to increase the frequency of failure in the wear-out phase. Clearly all manufacturers strive through design and quality control discipline to run the whole tub downwards by minimising the frequency of failure during normal operating and to push out the boundaries of the normal operating phase to minimise the period of infant mortality and lengthen the time to wear out. The shape of this curve influences a company's warranty period, which will normally extend at least through the infant mortality phase. An acceptable number of in-warranty failures varies between products but is always closely defined before product introduction. Careful monitoring of warranty problems thus highlights any component which has a failure rate in excess of its acceptable level.
Failures in-warranty are thus fairly easily identifiable in terms of the rate and number of failures, but what is often a major problem is defining the precise nature of the failure in terms of the vehicle operation so that solutions to the problem can be simulated by rig or prototype testing to ensure that the failure does not recur in service.
Failures in normal operation are much more difficult to deal with since good information is not always available. A problem in one operation may not exist in another and only by combining close service contact with the operator together with statistical analysis techniques can a manufacturer make best use of his limited development resources.
These techniques are used extensively by Truck & Bus and were used to great effect with a particular problem child — the BMC 5.7-litre engine. Careful analysis of warranty failures plus close service contact with a variety of operators, not only in UK but throughout the world, showed that the problems with the engine were limited to three major areas: cylinder block, cylinder liner and cylinder head. But this information alone was not sufficient to design and incorporate changes to the engine ensuring that the problems would be eliminated. The problems had to be indentified much more closely with positive identification of the causal factors. Once these were known, design could commence, followed by prototyping and a rigorous test and development programme.
Fig 7 shows the result graphically. Continuous improvement to the engine and engine environment made possible a gradual improvement in failure rates culminating in a new version of the engine which has very little similarity to the original 5.7-litre and incorporates a different bore/stroke characteristic. Failure rate improvement with resultant cost improvement of this nature is typical of the development process and its interaction with the service/field feedback system.
The conclusion of this paper is that the transport equation is complex and diverse. It is dependent on factors which are finely balanced between what is desirable and what is possible, what is possible and what is economically justified — it is complex because human beings are complex and diverse because human reiaionships are diverse and be cause of that it is a fascinating equation. To be solved it needs information, dedication and in gentfity both on the part of transport operators, vehicle manufacturers and legislators.
It needs a twoand three-way communication at conferences, at technical liaison meetings between manufacturers and operator representatives and at personal level between the big and small operators of transport services and manufacturer's personnel and at some times it needs patience.
Few other countries depend for their economic survival on road transport as Britain, few have so many suppliers competing for the transport opera tors' business. If the industry is to continue to improve its efficiency against a background of ever more complex tech nology it is clear that an increasing level of investment in research into transport tech niques, manufacturing technology, human factors, mate rials, power sources and all other elements in the total industry mix will be necessary.
Only high rate volumes will be able to support such invest ments, and consequently not all manufacturers and few users will be able to afford the level of resources to fund the effort. As a result, it is inevittable that there will be further contraction in the number of manufacturers serving the market and a continuing movement towards a smaller number of larger fleet operators.


