


3ritain's bus mrvices at .he crossroads
Page 48
Page 49
Page 50
If you've noticed an error in this article please click here to report it so we can fix it.
by Martin Watkins
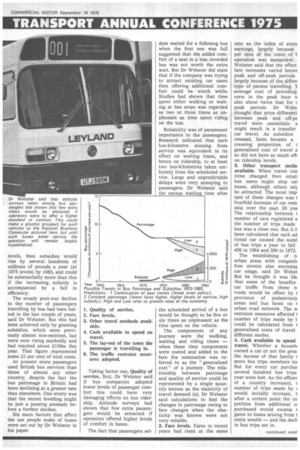
'ATEVER course of action 'allowed it seems unlikely bus patronage can be t at present levels without wring enormous costs rugh operating subsidies, annual conference of 'the °dation of Public Passen Transport was told at irnemouth on Wednesday. his was one of a number of leasant predictions made Dr Vernon Webster, of the nsport and Road Research oratory, speaking on "Bus Tel and the next 10 years." described what I would call atch 22 situation.
a break-even policy were pted for the future, he said, fares would be likely to vase in real terms while rice levels would be reed. And patronage might I fall to between half and ?e-quarters of present levels 1985.
ut if attempts were made to patronage at present ls by reducing fares in real ns and by increasing ser levels, then subsidies ild rise to several hundreds million pounds per year in (ears, and could be substanly more than this if the inising subsidy was accornied by a fall in efficiency. r Webster's main concluis were : Ius patronage levels (stage rice) have now fallen to ut half the peak level Lined lin 1950 and whereas il a few years ago all untakings were managing to ak even, this is no longer ?, and subsidies have now :hed about £150 million a r.
)espite the severe decline in ronage, Britain still has one the highest ridership levels any country for which stales are available and this is .3 even on a per capita basis. However, many countries have ridership levels which have been constant for many years and it is plausible that their constant patronage trends may continue, whereas in Britain, it is equally plausible that the downward trend may return unless strong counter-measures are taken.
3. The factors which have the greatest bearing on public transport usage are car ownership levels, fares, service (number of bus-kilometres), reliability, and planning factors (traffic restraint, decentralisation of workplaces and suburbanisation).
4. TRRL studies suggest that the service elasticity (with re spect to bus-kilometres) is unlikely to be appreciably greater on average than the fares elasticity (under break-even conditions), though there is likely to be considerable variation in these values, and there will certainly be many individual cases where the reverse is true.
5. The implication of these four points is that there would appear to be no convincing argument in favour of largescale improvements to services by the use of extra buses paid for out of higher fares, though again, there may be individual cases where this is the right decision.
Only if the value of time spent waiting and walking is seriously underestimated would improved service at higher fares be worth while.
6. Reliability is one of the most important aspects of service and, where appropriate, rescheduling at lower frequencies using a small pool of reserve buses to ensure a complete service could prove beneficial.
7. The cost of operating bus services is increasing and is a major factor in taking decisions on fares, subsidies and level of service. There may possibly be some scope in making better use of both the human and material resources, though there are undoubtedly institutional difficulties.
8. If a break-even policy is adopted for the future, fares would be likely to increase in real terms while service levels would be reduced, and patronage might well fall to between half and three-quarters of the present levels by 1985.
9. If attempts are made to hold patronage at present levels by reducing fares in real terms and by increasing service
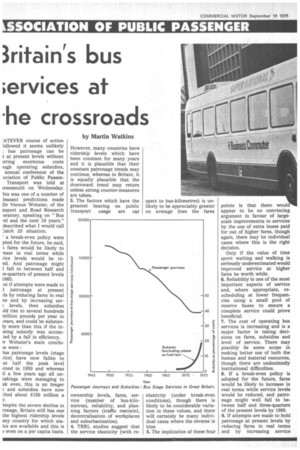
Dr Webster said that attitude surveys taken among bus passengers had shown that few extra riders would be attracted if operators were to offer a higher standard of comfort. This could make a gloomy prospect for such vehicles as the National Business Commuter pictured here, but until such buses enter service the question will remain largely hypothetical.
levels, then subsidies would rise by several hundreds of millions of pounds a year (at 1975 levels) by 1985, and could be substantially more than this if the increasing subsidy is accompanied by a fall in efficiency.
The steady post-war decline in the number of passengers travelling by bus had been halted in the last couple of years, said Dr Webster. But this had been achieved only by granting subsidies, which were previously almost non-existent, but were now rising markedly and had reached about £150m this year. That figure represented some 23 per cent of total costs.
At present more passengers used British bus services than those of almost any other country, despite the fact the bus patronage in Britain had been declining at a greater rate than elsewhere. One worry was that the recent levelling might be just a passing anomaly before a further decline.
Six main factors that affect the use people make of buses were set out by Dr Webster in his paper. 1. Quality of service.
2. Fare levels.
3. Other travel methods available.
4. Cash available to spend on travel.
5. The lay-out of the town the passenger is travelling in.
6. The traffic restraint measures adopted.
Taking factor one, Quality of service, first, Dr Webster said if bus companies adopted lower levels of passenger comfort this could have very damaging effects on bus ridership. Attitude surveys had shown that few extra passengers would be attracted if operators offered higher levels of comfort in buses.
The fact that passengers sel dom waited for a followng bus when the first one was full suggested that the added comfort of a seat in a less crowded bus was not worth the extra wait. But Dr Webster did state that if the company was trying to attract existing car users then offering additional comfort could be worth while. Studies had shown that time spent either walking or waiting at bus stops was regarded as two or three times as unpleasant as time spent riding on the bus.
Reliability was of paramount importance to the passengers. Research indicated that each bus-kilometre missing from service was equivalent in its effect on waiting times, and hence on ridership, to at least two bus-kilometres taken uniformly from the scheduled service. Large and unpredictable delays were very annoying to passengers. Dr Webster said the excess waiting time after the scheduled arrival of a bus would be thought to be five or six times as unpleasant as the time spent on the vehicle.
The components of any journey were the walking, waiting and riding times — when these time components were costed and added to the fare the summation was referred to as the "generalised cost" of a journey. The relationship between patronage and quality of service could be represented by a single quantity known as the elasticity of travel demand (e). Dr Webster said calculations to find the changes in patronage owing to fare changes when the elasticity was known were not very reliable.
2. Fare levels. Fares in recent years had risen at the same rate as the index of avert earnings, largely because per cent of the costs of t operation was manpower. Webster said that the effect fare increases varied betwE peak and off-peak periods largely because of the differ( type of person travelling. 'I average cost of providing crew in the peak hour IA also about twice that for c peak periods. Dr Webs thought that price differenti between peak and off-pc travel were unrealistic a might result in a transfer car travel. As subsidies creased, fares became a creasing proportion of I generalised cost of travel a so did not have so much eff. on ridership levels.
3. Other transport meth( available. When travel con tions changed then existi bus users might stop usi buses, although others mil be attracted. The most imp tant of these changes was 1 fourfold increase of car own ship over the past 20 yea The relationship between number of cars registered a the number of trips made bus was a close one. But it Ii been calculated that each ad tional car caused the numl of bus trips a year to fall 450 in 1964 and 300 in 1972.
The establishing of n, urban areas with congestic free streets also encourag car usage, said Dr Webst But he thought it was liki that some of the benefits car traffic from these n. roads would be offset by t provision of pedestriani. areas and bus lanes on I urban road network. The w restraint measures affected I number of trips made by t could be calculated from 1 generalised costs of travel different modes.
4. Cash available to spend travel. Whether a househi owned a car or not the grea. the income of that family t more bus trips members to But for every car purcha5, several hundred bus trips year were lost. As the affiuer of a country increased, t number of trips made by would initially increase, after a certain point the co petition from additional c; purchased would swamp t gains to buses arising from t extra wealth — and the decli in bus trips set in. rown lay-out. The process lispersion and suburbanisawas first made possible by efficient transport system. ortunately, these decenisation processes were coning beyond the point where 'as practicable to satisfy all 'el needs by public trans:. Car-owning households led to settle where car tsport was relatively easy, ; reducing the demand for lie transport still further. own planners should aim encouraging higher-density Low-density living crea a need for transport oh could be satisfied only the car, while car owning an important influence in demand for low-density lg.
Restraint. Restraint meas; against private traffic Lid make more people cap to public transport, at t in the short term, said Webster. But in the longer a restraint measures could date the rate of suburbanion. Until now town planhad responded to people's res to live in an environit conducive to the use of ;. In the long-term, car re m nt ,policies might give e benefit, or even result in to public transport.
luenee
icreasing national affluence : brought a rise in public Lsport patronage, followed Levelling off and then a de e as the number of cars eased. The countries with eclining ridership were the .er nations with high levels car ownership, especially ;.e that had catered for the 'ate car by road-building rarnmes and widespread urbanisation. Flat ridership ids were exhibited in some o nean countries because lack of suburbanisation been the wars meant that ry essential journeys to k, etc, were very short. A :ain amount of traffic reLint and high levels of sub could keep ridership stant.
many countries deficits e more than half the rating costs. Many opera; in North America and ope were concerned that ;sive subsidies could result in an over-provision of services and inefficient use of resources.
Dr Webster disputed the historical data for fares and service elasticities. These two quantities had been thought to be minus 0.3 and plus 0.7 respectively, meaning that a 10 per cent increase in fares could be expected to result in 3 per cent drop in ridership, and a 10 per cent service improvement could increase ridership by seven per cent. In fact, a better figure would be 0.4 for both elasticities, said Dr Webster.
The bus industry was at present about 70 per cent labour intensive. Also operating costs varied with the " peakiness " of the service offered, which could result in many overheads being loaded on to the shortpeak period.
If crews could be engaged on other duties in the off-peak periods, such as office work, servicing or cleaning, then a saving of 25 per cent in crew costs would be possible — a 10 per cent saving in overall costs. At present in Merseyside PTE, said Dr Webster, for every crew-hour in service 1.6 hours were paid for. He mentioned a joint freight and passenger system which was being studied by TRRL as a possible means of improving the efficiency.
Reliability o; the service was regarded by Dr Webster as being of paramount importance. He mentioned two methods of improving this : 1. To carry more spares and pay higher rates, either to recruit more staff or to reduce the wastage rate.
2. To re-schedule the service at a lower frequency and to supplement the depleted services from a small pool of reserve buses.
Wastage
He was not enthusiastic about the first method as he reported that a one per cent increase in earnings would reduce the wastage rate by five per cent, thus each additional driver would cost one and a half times the average of existing drivers.
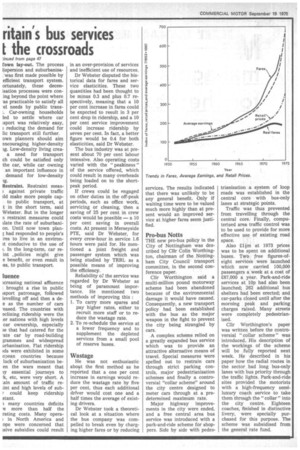
Dr Webster took a theoretical look at a situation where the bus company was compelled to break even by charging higher fares or by reducing services. The results indicated that there was unlikely to be any general benefit. Only if waiting time were to be valued much more highly than at present would an improved service at higher fares seem justified.
Pro-bus Notts
THE new pro-bus policy in the City of Nottingham was described by Cllr Colin Worthington, chairman of the Nottingham City Council transport committee, in the second conference paper.
ClIr Worthington said a multi-million pound motorway scheme had been abandoned because of the environmental damage it would have caused. Consequently, a new transport policy had been established with the bus as the major weapon in the fight to prevent the city being strangled by cars.
A complex scheme relied on a greatly expanded bus service which was to provide an attractive alternative means of travel. Special measures were spelled out to restrain cars through strict parking controls, major pedestrianisation schemes and finally a controversial "collar scheme" around the city centre designed to meter cars through at a predetermined maximum rate.
Major highway improvements in the city were ended, and a free central area bus service was introduced with a park-and-ride scheme for shoppers. Side by side with pedes trianisation a system of loop roads was established in the central core with bus-only lanes at strategic points.
Traffic was thus prevented from travelling through the central core. Finally, computerised area traffic• control was to be used to provide for more effective use of existing road space.
Also £1m at 1973 prices was to be spent on additional buses. Two free figures-ofeight services were launched which now carried 100,000 passengers a week at a cost of £87,000 a year. Park-and-ride services at 10p had also been launched; 262 additional bus shelters had been erected; and car-parks closed until after the morning peak and parking charges raised. Many streets were completely pedestrianised.
ClIr Worthington's paper was written before the contrOversial "collar scheme" was introduced. His description of the workings of the scheme will be fully reported next week. He described in his paper how the radial routes in the sector had long bus-only lanes with bus priority through the traffic lights. Park-and-ride sites provided the motorists with a high-frequency semiluxury coach service to take them through the " collar " into the city centre. Eighteen coaches, finished in distinctive livery, were specially purchased for this purpose. The scheme was subsidised from the general rate fund.