


Distribution trends: Evaluating cost and performance
Page 49
Page 50
Page 51
If you've noticed an error in this article please click here to report it so we can fix it.
by John Darker AMBIM
In recent years there has been an encouraging readiness on the part of many companies operating large distribution networks to make available at least some comparative information touching on cost and performance. The food industry, particularly, through its Institute of Grocery Distribution, has arranged a number of conferences, and many of its proceedings have been published.
The Whitehead Consulting Group's "National Survey of Physical Distribution Management" estimated that more than £1,000m a year was probably being lost by British industry through the inefficient use of transport and warehousing, and inadequate management of the distribution process. Whitehead researchers found that most companies were more concerned to measure their level of sales, stock availability and service to customers than the assessment of distribution resources.
Introspection
While it is natural for companies to be introspective about their own distribution efficiency because of its key role in marketing success, cost factors may well be submerged: you can be "efficient" in an extravagant fashion.
It can be deduced from the efforts of professional distribution service companies to attract new business, that their cost/ efficiency, and profit margins, are highly sensitive to throughput. A national distribution network such as is offered by a handful of well-known companies in the independent and State sectors, is highly expensive to establish and maintain. Its break-even factor may require it to operate virtually flat out — especially having regard to infla tionary factors. Half-empty warehouse buildings, partially occupied vehicles, and over-staffing in relation to total throughput can seriously erode turnover.
On the national score, with investment in manufacturing industry at a dangerously low level, there seems little prospect of any substantial investment in distribution as a whole, if we except national investment in roads, railways and infrastructures — which could include peripheral urban distribution depots. There seems little sign of any pressure from the Government for distribution to be rationalized as an activity in itself, apart from broad exhortations from all political parties for industry to send more goods by rail.
Expense
As a contribution to distribution efficiency the Freightliner system is making a growing impact, but vastly greater savings could, in theory, be made from greater rationalization of distribution networks now independently controlled.
For example, in the oil industry it is common form for expensive networks of pipelines to be shared by competing companies. How long will it be before the imperative need to deploy all resources sensibly compels serious consideration by competitor companies of the shared use of premises, staff, and vehicles engaged in distribution?
This process is under way, and it was given a stimulus by the 1968 Transport Act. But much more could be done, though attitudes will have to change faster. Distribution service companies with specialized depot networks offering national distribution facilities are already with us; perhaps the next logical development is for competing manufacturing or marketing companies, eg glassware, chemicals, carpets, furniture, bananas — the list could be extended — to set up joint distribution net works using the best of existing premises, vehicles and warehouse and traffic staffs.
Research
The National Economic Development Office Commissioned the National Materials Handling Centre to undertake some research for an inter-firm comparison scheme in food distribution. This study was confined to warehousing operations, from the receipt of goods from incoming transport to the loading of goods into delivery vehicles, and to the associated transport operations to wholesale or retail outlets.
The recently published report of a conference arranged by NMHC summarises the research data collected for the food distribution survey and in addition it contains the lectures and discussions given by distribution experts from such companies as Berger, Jenson and Nicholson,sHoover, Bass Marketing and Cory Distribution Services. Any serious student of distribution would be well advised to get a copy of this most valuable book.
In the food distribution study the influence of throughput and drop density on cost is strikingly illustrated. A graph published in the book brings together a set of curves covering warehouse, transport, inventory and administration cost and shows that a company currently delivering 20,000 cases per week and travelling 10,000 miles to deliver them, could lower its cost from approximately 23p per case to less than 6p per case if its throughput to the same outlets rose to 150,000 cases/week. It costs about 5p per case when 30 cases per mile are delivered and nearly three times as much when only two cases per mile are delivered, assuming the 150,000 cases per week.
Savings
The figures are striking enough to illustrate the huge potential savings in distribution, though the economy achieved could affect delivery frequency or service level.
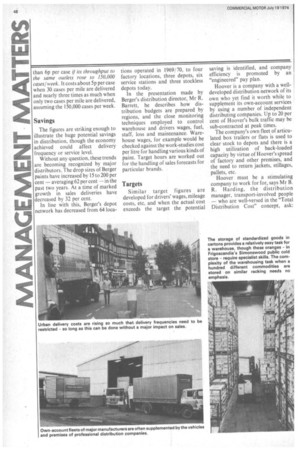
Without any question, these trends are becoming recognized by major distributors. The drop sizes of Berger paints have increased by 15 to 200 per cent — averaging 62 per cent —in the past two years. At a time of marked growth in sales deliveries have decreased by 32 per cent.
In line with this, Berger's depot network has decreased from 64 loca tions operated in 1969/70, to four factory locations, three depots, six service stations and three stockless depots today.
In the presentation made by Berger's distribution director, Mr R. Barrett, he describes how distribution budgets are prepared by regions, and the close monitoring techniques employed to control warehouse and drivers wages, fuel, staff, loss and maintenance. Warehouse wages, for example would be checked against the work-studies cost per litre for handling various kinds of paint. Target hours are worked out for the handling of sales forecasts for particular brands.
Targets
Similar target figures are developed for drivers' wages, mileage costs, etc, and when the actual cost exceeds the target the potential saving is identified, and company efficiency is promoted by an "engineered" pay plan.
Hoover is a company with a welldeveloped distribution network of its own who yet find it worth while to supplement its own-account services by using a number of independent distributing companies. Up to 20 per cent of Hoover's bulk traffic may be sub-contracted at peak times.
The company's own fleet of articulated box trailers or flats is used to clear stock to depots and there is a high utilization of back-loaded capacity by virtue of Hoover's spread of factory and other premises, and the need to return jackets, stillages, pallets, etc.
Hoover must be a stimulating company to work for for, says Mr B. R. Harding, the distribution manager, transport-involved people — who are well-versed in the "Total Distribution Cost" concept, ask: "Why cannot the factory make products in the right mix to give us full trailer loads every time? Why do marketing insist on multi-colour, multi-styling variants of each product?"
In the real world, distribution people have to reconcile their cost patterns with those of the production and marketing teams. Uneconomic van loads may have to be run to keep a factory going or to clear a dispatch department that is choked with stock. Stock carefully allocated in accordance with local demand may have to he uplifted urgently to meet a special promotion in a different part, of the country.
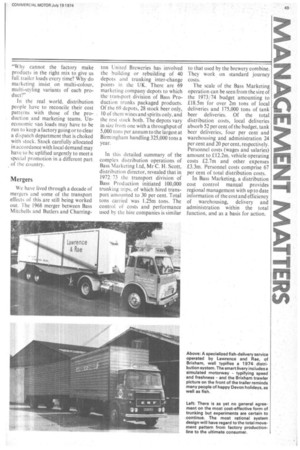
Mergers We have lived through a decade of mergers and some of the transport effects of this are still being worked out. The 1968 merger between Bass Mitchells and Butlers and Charring ton United Breweries has involved the building or rebuilding of 40 depots and trunking inter-change points in the UK. There are 69 marketing company depots to which the .transport division of Bass Production trunks packaged products. Of the 69 depots, 28 stock beer only, 10 of them wines and spirits only, and the rest stock both. The depots vary in size from one with a throughput of 5,000 tons per annum to the largest at Birmingham handling 325,000 tons a year.
In this detailed summary of the complex distribution operations of Bass Marketing Ltd, Mr C. H. Scott, distribution director, revealed that in 1972, 73 the transport division of Bass Production initiated 100,000 trunking trips, of which hired transport amounted to 30 per cent. Total tons carried was 1.25m tons. The control of costs and performance used by the hire companies is similar to that used by the brewery combine. They work . on standard journey costs.
The scale of the Bass Marketing operation can be seen from the size of the 1973/74 budget amounting to £.18.5m for over 2m tons of local deliveries and 175,000 tons of tank beer deliveries. Of the total distribution costs, local deliveries absorb 52 per cent of the budget, tank beer deliveries, four per cent and warehousing and administration 24 per cent and 20 per cent, respectively. Personnel costs (wages and salaries) amount to £.12.2m, vehicle operating costs £2.7m and other expenses £.3.3m. Personnel costs comprise 67 per cent of total distribution costs.
In Bass Marketing, a distribution cost control manual provides regional management with up to date information of the cost and efficiency of warehousing, delivery and administration within the total function, and as a basis for action.