 1
1 2
2 3
3 4
4 5
5 6
6 7
7 8
8 9
9 10
10 11
11 12
12 13
13 14
14 15
15 16
16 17
17 18
18 19
19 20
20 21
21 22
22 23
23 24
24 25
25 26
26 27
27 28
28 29
29 30
30 31
31 32
32 33
33 34
34 35
35 36
36 37
37 38
38 39
39 40
40 41
41 42
42 43
43 44
44 45
45 46
46 47
47 48
48 49
49 50
50 51
51 52
52 53
53 54
54 55
55 56
56 57
57 58
58 59
59 60
60 61
61 62
62 63
63 64
64 65
65 66
66 67
67 68
68 69
69 70
70 71
71 72
72 73
73 74
74 75
75 76
76 77
77 78
78 79
79 80
80 81
81 82
82 83
83 84
84 85
85 86
86 87
87 88
88 89
89 90
90 91
91 92
92 93
93 94
94 95
95 96
96 97
97 98
98 99
99 100
100 101
101 102
102 103
103 104
104 105
105 106
106 107
107 108
108 109
109 110
110 111
111 112
112 113
113 114
114 115
115 116
116 117
117 118
118 119
119 120
120 121
121 122
122 123
123 124
124 125
125 126
126 127
127 128
128 129
129 130
130 131
131 132
132 133
133 134
134 135
135 136
136 137
137 138
138 139
139 140
140 141
141 142
142 143
143 144
144 145
145 146
146 147
147 148
148 149
149 150
150 151
151 152
152 153
153 154
154 155
155 156
156 157
157 158
158 159
159 160
160 161
161 162
162 163
163 164
164 165
165 166
166 167
167 168
168 169
169 170
170 171
171 172
172 173
173 174
174 175
175 176
176 177
177 178
178 179
179 180
180 181
181 182
182 183
183 184
184 185
185 186
186 187
187 188
188 189
189 190
190 191
191 192
192 193
193 194
194 195
195 196
196 197
197 198
198 199
199 200
200 201
201 202
202 203
203 204
204 205
205 206
206 207
207 208
208 209
209 210
210 211
211 212
212 213
213 214
214 215
215 216
216 217
217 218
218 219
219 220
220 221
221 222
222 223
223 224
224 225
225 226
226 227
227 228
228 229
229 230
230 231
231 232
232 233
233 234
234 235
235 236
236 237
237 238
238 239
239 240
240 241
241 242
242 243
243 244
244 245
245 246
246 247
247 248
248 249
249 250
250 251
251 252
252 253
253 254
254 255
255 256
256 257
257 258
258 259
259 260
260 261
261 262
262 263
263 264
264 265
265 266
266 267
267 268
268 269
269 270
270 271
271 272
272 273
273 274
274 275
275 276
276 277
277 278
278 279
279 280
280 281
281 282
282 283
283 284
284 285
285 286
286 287
287 288
288 289
289 290
290 291
291 292
292 293
293 294
294 295
295 296
296 297
297 298
298 299
299 300
300 301
301 302
302 303
303 304
304 305
305 306
306 307
307 308
308 309
309 310
310 311
311 312
312 313
313 314
314 315
315 316
316 317
317 318
318 319
319 320
320 321
321 322
322 323
323 324
324 325
325 326
326 327
327 328
328 329
329 330
330 331
331 332
332 333
333 334
334 335
335 336
336 337
337 338
338 339
339 340
340 341
341 342
342 343
343 344
344 345
345 346
346 347
347 348
348 349
349 350
350 351
351 352
352 353
353 354
354 355
355 356
356 357
357 358
358 359
359 360
360 361
361 362
362 363
363 364
364 365
365 366
366 367
367 368
368 369
369 370
370 371
371 372
372 373
373 374
374 375
375 376
376 377
377 378
378 379
379 380
380 381
381 382
382 New techniques in transport
Page 264
Page 265
Page 266
Page 267
Page 268
If you've noticed an error in this article please click here to report it so we can fix it.
by K. P. H. Fielding, TD, MIOM, AITA, AMORS, MOMS
It is the purpose of this paper to review the current position in the field of applying new management techniques in the transport and distribution activity. There has been considerable development in the past few years, and we are fortunate in this country in at last having a comprehensive and modern reference book on the subject—Physical Distribution Management, edited by Felix Wentworth. This makes the task of reviewing the "state of the art" much more manageable, but even if one were to examine the developments since the book was written, there is plenty to observe in such a fast-moving field.
Before investigating developments in detail, however, it would be advisable to set the scene and place the role of
management science (MS) in perspective. The past few years have seen a massive increase in the attention being paid to distribution activities, particularly by top management. The reasons for this are not hard to find. Apart from recent legislation, one can cite:—
The rapid rise in distribution costs, in which increased taxation has played a not inconsiderable part.
The increasing complexity of distribution caused by such factors as industrial changes and mergers, and pressure for improved lead time.
The spread of electronic data processing (EDP) facilities, and the inroads 'which computers inevitably make into the distribution department.
No substitute for management
All this has resulted in more resources being made available to study distribution requirements, and this reinforces the need to define the proper place of management science and EDP. These activities, which appear to work in such mysterious ways, are an aid to management, not a substitute for it. The level of effectiveness Which is achieved in a distribution activity will result, as in any other function, from a number of influences and factors. These include: the quality of the direction from the top, the competence of the people employed, the resources allocated and the efficiency of the control systems; and the use of management science is no more than one of these factors. Nor is management science an automatic problem solver, a "black box" into which all problems can be fed and from which correct and comprehensive answers will always flow.
I-laving described the place and the limits of management science, we also need to define the conditions in which it can make a valid contribution to distribution management. First, of course, is the competence of the MS staff. Next are the facilities and support which they are given in doing their job. Following this is the accuracy of the costing and other data available within the organization, and finally the use which is made of the results by line management.
The availability—or lack—of costing information is notoriously a great stumbling block in management science, particularly in the distribution field, where so much is swallowed up in "overheads". Sometimes the most valuable contribution which MS can make is to improve costing information. This is achieved not by the use of abstruse mathematical techniques but by knowing what the information can be used for and by the application of the quantitative approach and the analytical skill which the management scientist develops in his job. Cost accounting is too important and too complex to be left to the cost accountant.
Joint application
The use made of the results is always the key factor at the end of the day. In no case should the results derived from a simulation model, a linear program or some other computer run be used willy-nilly to determine a course of action. Mathematical models are always simplifications of a real life situation, and the results must always be checked before they can be applied. This job cannot be done by line manager or management scientist alone; it must be done jointly. The value of MS is that if this process has been well done, a decision can be made which will almost always be better than it might otherwise have been.
For the widespread use of MS techniques the capability of the computer is necessary. In the application of mathematical techniques in research, design and engineering, vast quantities of calculations need to be made in the analysis of complex structures. Distribution is a complex structure, and the same requirements apply—perhaps even more acutely, since distribution patterns change, and one therefore needs the ability to carry out the calculation task quickly enough for the results still to have relevance to the live situation. This requirement makes use of one of the two main strengths of the computer, its calculating speed.
The computer also has a part to play in the administration of activities, and in this role its other main capability is utilized, its capacity to store vast quantities of data, and to retrieve, correlate and present these data in extremely fast time. This particular facility is that required for such operations as the maintenance of detailed costing systems which produce up-to-date information (such as that needed for vehicle costing and replacement), delivery costing for incorporation in pricing systems, inventory recording and control systems.
What computers can do
It is very important for managers in transport and distribution to have a clear understanding of the capabilities of EDP not in the more rarefied mathematical areas but so that they can take full advantage of EDP facilities in the areas of vehicle costing, stock control, etc. In some applications, such as inventory control, "packages" are available from the computer manufacturer but they need scrutiny to ensure that they do precisely the job required of them. In other areas there are no packages and the computer system must be designed from scratch. In both cases it is vital for the distribution manager to identify what he needs no later than the systems design stage, since the major disadvantage of computer systems is the difficulty of altering them; this is where knowledge of EDP capabilities is so valuable.
The distribution study
Management scientists have always been interested in transport and distribution problems: the oldest operational research technique, linear programming, uses a distribution problem as its classic textbook example—in fact, it is sometimes known as the "transportation technique". The example is that in which there are different stocks of a commodity at a number of depots to be delivered to a number of delivery points in specified amounts, and the cost of transport from each depot to each delivery point is directly proportional to the amount to be transported—hence the "linear" in the title. The problem is to supply the delivery points in such a way that the overall delivery costs are minimized.
When starting a distribution study, it is important to recognize that the use of the techniques described later will not normally overcome basic flaws in the distribution system. The study must be based on considering all the alternatives which are open and, in this area, the application of industrial engineering thinking will play the major part. The value of MS is in the accuracy of the evaluation of these alternatives which it makes possible.
One must also realize that distribution is a system, with one extremity in production and the other in marketing, and it interacts with both. It is also a system with a number of components, and the whole system is changed by a change in one part. It is therefore dangerous to tinker with a system without studying the effects which change will have elsewhere, since a change in one part, designed to reduce costs, may produce extra costs elsewhere which will make the total system more expensive. Similarly, changes in part of the system may adversely affect overall service levels. The overall study of a distribution system needs to be based on a firm foundation of industrial engineering and transport planning. Some complicated distribution systems can be radically simplified if careful thought is given to the design of the transport system. It is therefore important that the investigation of distribution systems should be a multi-discipline operation, typically including cost analysis, materials handling, industrial engineering, transport planning and operational research.
The techniques described in this paper have been developed, and for the most part are available, in the form of packages or computer programs. In practice, they cannot usually be applied as they stand, and they should not be used in this form by laymen or by EDP staff who do not know anything about distribution. The application of a package to one part of a distribution system will run the risks described above, of changing one. part of a complex structure. The techniques themselves, however, can be of considerable value and can sometimes be used in their package form at the appropriate stage of a comprehensive survey. They can also be used in building total distribution analysis models and also in the construction of control models, where one wishes to monitor the performance of a system by reference to a standard: this usually requires the administrative operation to be sufficiently computer-based for those techniques to be incorporated.
Vehicle routeing
The problem of routeing vehicles to perform multi-drop deliveries naturally attracted early attention from the management scientist, but the production of satisfactory programs has taken a great deal of time. Some of the difficulties which have arisen are simply those which one must expect with research and development—one starts with a crude solution and gradually produces refinements in the light, of experience. Other snags, more serious, have arisen from an imperfect appreciation on the part of the management scientist of the ultimate objective, and this in part has followed from imperfect communications with line management. The obvious example of this is the concentration there has been, and still is, on minimizing mileage. This does not automatically—or even usually—reduce fleet size, which is the principal cost factor.
On the other hand a vehicle planning program which maximizes the use of the fleet can be expected to minimize cost. Programs have been developed by the computer manufacturers which use out-of-date methods, and these are still supplied as though they were the best available, when the opposite is now the case.
The original "savings" algorithm, on which many of these packages are still based, was developed by Fletcher, Clark and Wright. It was designed to minimize mileage, and was based on certain simple concepts. These were:—
That the linking of two delivery points in a triangular route produced a saving in mileage (over making separate out-and-back trips) which could be measured. That the savings from linking pairs of points can readily be stored in computer backing memory, in order of size of saving.
That using the computer's facility for rapid retrieval of data, these savings can quickly be extracted and used by comparison to link delivery points together to form routes that maximize mileage savings.
There is still some theory attached to this approach: in fact, the routes chosen do not represent the best possible available; the "savings" algorithm would require a very large CPU (central processing unit)—larger than normally available—to get significantly closer. The more fundamental defect is that referred to above; programmes incorporating the algorithm minimize mileage, rather than the number of vehicles. In addition these particular programmes will bring the vehicle back to the depot when its load has been delivered, but have no means of using any time still available before the end of the shift; attempts to do this manually will necessitate another computer run, and in a large problem this will be prohibitively expensive in both traffic planner and computer time. In other words these programs schedule routes, not vehicles.
Practical factors
These handicaps have naturally given rise to development in two directions; improvements in the routeing to get nearer to the optimum without imposing penalties in computer size or run time, and improving the "engineering" of the programs so that they meet the primary objective of minimizing fleet size, enabling vehicle time to be fully utilized, and generally taking full account of the practical problems in vehicle operations.
The first of the two developments results from work at Imperial College and is known as the "r-optimal tour" solution. Briefly, this states that if a route is constructed on any basis, a near-optimal route (i.e. a near approach to a route involving the least distance) can be obtained as follows. Break any three links, try all the ways in which the points so disconnected can be joined, measure the tour each one produces, choose the tour with the shortest distance and then go on to check all other three links. The important part of the approach is that although in theory all possible links should be tried for all points, the improvement in results by so doing is extremely marginal compared with examining three links at a time, and the computing capacity required for all possible links is so enormous as to be impracticable. Breaking two links will not get near an optimal route. The formula for calculating the number of different linkings possible by breaking n links is
2n1 (m-1)! From this we can see:
Another most promising approach is that developed by O'Brien and now available through Leasco as "Program Deliver". This approach is more advanced than the savings algorithm and thereby produces better routes; it also applies specific vehicles to particular routes. It achieves this by choosing an out-and-back route to one delivery point, and adding in other delivery points to the route by choosing them in the order of maximum reduction in "strain". The "strain" for a network is the cost, at any stage, of making all remaining unallocated calls direct from depot. The reduction is calculated in terms of the saving achieved by "hooking in" a delivery point to the route being constructed, i.e. the return journey time to that point from the depot less the time added to the route making the call expressed as a ratio of the time added to the route. This is particularly valuable at the next stage, when every other delivery point is considered for the route under construction. It is possible that another delivery point could be hooked in and produce the same saving, but at a much higher extra time cost, and this would rank less favourably. If a vehicle delivers to capacity with time to spare, it is sent on another route before another vehicle is started.
Depot siting
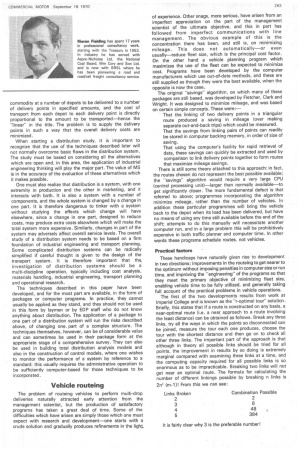
A number of programs have been developed for the siting of depots, and it is interesting to note the special features which individual programs possess. A common basis for depot siting programs is the computer equivalent of the "gravity" model—using strings joined together and weights proportional to the volume of deliveries over a period—as illustrated here.
The job which the gravity model performs is to minimize the ton-miles incurred in delivering stated volumes to given delivery points. The computer version does this by varying the location of the depot so that the ton-miles total reduces to the point where no movement of the depot will reduce it any further. This it does on a trial and error basis, so you can imagine a large number of calculations involved, and this of course is the computer's strong suit. The computer gravity-type model comes into its own where more than one depot is involved. For example, if you know from cost calculations how many depots will be economic to distribute over England, Scotland and Wales, the computer model will calculate where they should be and which delivery points should be serviced from which depot. All such programs allow barriers to be introduced to direct delivery, so that the grid from which one starts begins to look like a real map, and the calculations on which the depot siting is based do not assume that vehicles drive across rivers except at "pass points"—bridges.
The best compromise
Some models of this type, like the ICL package, have additional facilities, to improve the amount of practical assistance they give. In the ICL program the user specifies the number of depots, and can fix the location of a number of these himself. This takes account of the practical situation of an organization which already has some depots which it does not want to alter, perhaps in the shape of distribution facilities as part of manufacturing plants. The programme will accept these locations and build up the distribution configuration to make the best use of these. A further facility is to take into account the movement of goods into the distribution depots from the factory or port from which they emanate. In the ICL program "factories can be specified in fixed locations. The ton-miles over the whole distribution network are then minimized—the bulk flows from factory to depot are expressed as an amount which is less than the actual by the proportion that the costs of bulk movement are less than the costs of local distribution. This ensures that the factor which the program minimizes is comparable throughout the calculations.
The usefulness of programs with these facilities is clearly considerable, but one must ensure that it is the original objective which is met and not another which the program has unconsciously substituted. For example, it may be that minimizing ton-miles does not automatically minimize costs, and if the minimising of costs was the prime objective then the ton-miles model may only get somewhere near the solution needed.
An approach which tries to get nearer to the cost minimization objective is that of the Depsit system developed by Scientific Control Systems (late CEIR). This asks the user to specify a number of potential sites and the costs of establishing a depot on each potential site, and the costs of supplying each potential delivery area from particular sites. The program then calculates the minimum costs for the overall operation, including of course the optimum number of depots. A more complex version is also available and this has a similar facility to that of ICL; that of allowing for the costs of bulk movement to be included in the calculations, so that depot numbers and locations are chosen to minimize all these costs. There still remains the problem of the work involved in investigating possible sites, which may be prohibitively expensive—in time alone—for a national distribution requirement.
Step-by-step siting
Another approach which takes account of feasible sites and includes an allowance for the way warehouse costs behave at different levels of throughput is a computer version of the approach in Chapter 9 of Physical Distribution Management. This is the Wentworth "DEPOLOC" program and is available from A. T. Kearney, the consulting firm incorporating Norcross and Partners. Briefly this requires data about possible depot locations, costs of providing and running depots at varying throughput levels, costs of supplying each possible depot, demand (analysed by small market areas) and the costs of delivery to those areas from all locations under consideration. The algorithm then chooses the site which would produce the cheapest single depot operation, and then adds further sites one by one, in order of savings achieved, until the savings in transport costs achieved by adding further depots is out-weighed by the costs of providing and running the depots.
Further work on depot numbers is proceeding all the time, and models are being developed which attempt to produce the advantages which the Depsit type possess, but to avoid the necessity of detailed site evaluations, Professor EiIon of Imperial College has produced a set of models with a range of increasing complexity, and these form the basis of thhe approach which P-E take to this problem. They are: 1 A model which takes account of local distribution costs only.
2 A model which also includes trunking costs, but on the basis that these vary directly with distance.
3 A model in which the trunking costs are linear, as in (2), but can be "stepped".
4 A model in which trunking costs are dependent on the amount delivered and the district where the depot is sited, but not the distance from factory to depot. 5 A model similar to (4) but which also includes depot running costs.
From these descriptions it is clear that much progress is beeing made, but the major omission is often the cost of maintaining inventory. This can be a crucial factor, particularly when the now well-known law of inventory size is considered,
Inventory analysis
Inventory levels are related to depot numbers in a particular way: as you increase the throughput of a depot the stock you require to maintain the throughput increases, not in the proportion of the increase in throughput, but in proportion to the square root of the throughput. Conversely, if you reduce the throughput of a depot the decrease in stock required reduces only in proportion to the square root. Taking an example, a depot with a throughput of 1,600 tons a month which requires a stock of 3,200 tons for Servicing. If the throughput increases to 3,600, it will require not just over double the original stock (i.e. 7,200) but 4,800 tons. The relationship is: The conclusion therefore is that as we increase the size of a depot operation we obtain an economy of scale in inventory capital. What is just as important, however, in determining the number of depots to deal with a fixed total throughput, is that if we increase the number of depots we vastly increase the inventory required, and of course the space required to house it. Taking the example figures, if the total throughput for all depots is 14,400 tons a month, we could have four depots handling 3,600 tons each or nine depots handling 1,600 each. The inventory required for 3,600 = 4,800, so for 4 x 3,600(14,400) it will be 4 x 4,800 (19,200). For 1,600 it will be 3,200, so for 9 x 1,600 (14,400) it will be 9 x 3,200 (28,800), an increase of 50 per cent, and the cost of the extra 9,600 tons may well be decisive. In the extreme, the inventory required if only one depot is operated is 80V14,400 — 80 x 120 =. 9,600, or one-third of that needed when nine depots are operated. Although this cost factor is not always included in existing packages, it underlines the importance of assessing inventory requirements and the cost implications at the same time as carrying out the other calculations for depot numbers and locations, and not as an unrelated exercise.
This brings us to consider the facilities available for inventory analysis. Again a number of "packages" are available for stock control, but the operational research techniques available have been well known for some time and there are no recent developments to report. There is a gap here, in that inventory control is not sufficiently integrated in the distribution area, and future work will undoubtedly be in this direction. Individual .companies have conducted studies which assessed the implications on inventory levels of varying numbers of depots and the interaction of depot costs and economic order quantities to minimize overall costs. Such interactions are not considered in any programs currently available as packages, probably because of the complexity of the task giving such program general applicability. This adds strength to the case for a tailormade study, rather than the haphazard use of packages.
Cranfield warehouse model
This mathematical model of handling in a warehouse was developed by E. Kay of the Materials Handling Research Centre (published by Pergamon Press). It does not claim to provide a readymade set of formulae for tackling warehouse problems, but does provide the results of a good deal of the basic research which an operational research (OR) analysis of warehouse movements would necessitate. The ultimate objective of this work would be to examine the movements necessary to handle a given volume of goods in and out of the warehouse and the maintenance of a defined range of stock levels, to compare the costs of handling with the costs of constructing buildings of different shapes—from short and fat to tall and thin, and thereby to produce a warehouse design which would minimize the overall costs of providing and running the depot.
The model as described makes a number of fairly limiting assumptions, such as that the warehouse is fully racked, all locations directly accessible, and that movements are always in unit loads. Clearly development is needed in the inclusion of block stacking, and this is acknowledged in the book. Also order-picking needs more analysis than is given, and this also is referred to, with a sketch of the approach which could be followed. Up to the time when the Research Unit was merged into the newly formed Mintech MH Centre, Kay and his colleagues had gone a long way to computerizing the model, probably with developments along the lines indicated, and the use of this program was available to sponsors of the Research Unit (through the Institute of Materials Handling) or on a consultancy basis. It would be difficult to overestimate the value of a well developed warehouse design model, computerized to handle the large amount of data necessary.
H ocus
One of the most frequent problems in the area of manipulating resources is how to calculate the amount of resources which will satisfy a service need when the demands for the service vary in intensity and cannot be precisely predicted for a given time. What this boils down to in practice is the common-or-garden queue. For example, we know that however big we construct a goods reception area there will inevitably be a time when more vehicles arrive for unloading than the goods reception can handle: result—a queue. The practical problem is how large to make the facility to keep queues within defined limits. Straightforward mathematical solutions can be found to such problems only when they are very limited in size.
The more complex situations, and most of those met in everyday life are, need a different approach. Fortunately one of the most useful operational research techniques can provide assistance here, that of simulation. Fortunately also it is probably the easiest to understand, requiring no more than a knowledge of elementary statistics. A factor which should be emphasized at this point however is that, like computers, the quality of the answers depends almost entirely on that of the input. The use of simulation, like all operational research work, depends on careful and detailed data collection.
In simulation we take a real-life situation, analyse it to identify all the classes of events which can happen in real life, together with a measurement of the frequency range or probability with which they occur and the consequences which follow when they do occur. These are then fitted together, typically in a eomputer program together with a mechanism for selecting events to occur, and a means of measuring the consequences in quantitative terms—money, numbers of vehicles, or whatever—and storing them till the end of the exercise. The program is then started and runs as long as required. At the end the results are output and available for study. Having assessed the results of a certain line of action or allocation of resources we can readily change these and carry out another run, so comparing the results of different decisions over a significant period of time, having spent no resources except our own time and computer costs.
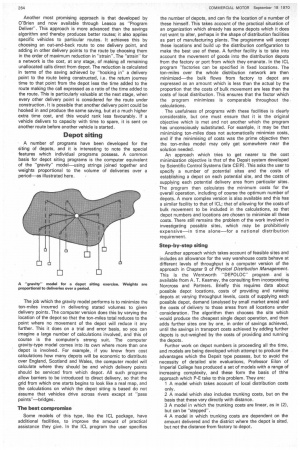
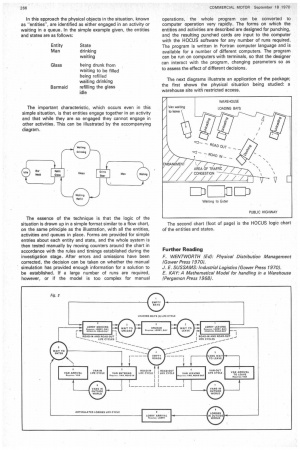
The layman can learn it Until recently this technique has been strictly for the OR specialist who could construct his own simulation model for each problem. In some fields this is still true, for example where the factors being simulated are abstract, as in finance. However, the modelling of tangible physical situations is now within the reach of the layman—after training of no more than three days—through the medium of the HOCUS package available from P-E Consultants. In this approach the physical objects in the situation, known as "entities", are identified as either engaged in an activity or waiting in a queue. in the simple example given, the entities and states are as follows: The important characteristic, which occurs even in this simple situation, is that entities engage together in an activity and that while they are so engaged they cannot engage in other activities. This can be illustrated by the accompanying diagram.
The essence of the technique is that the logic of the situation is drawn up in a simple format similar to a flow chart, on the same principle as the illustration, with all the entities, activities and queues in place. Forms are provided for simple entries about each entity and state, and the whole system is then tested manually by moving counters around the chart in accordance with the rules and timings established during the investigation stage. After errors and omissions have been corrected, the decision can be taken on whether the manual simulation has provided enough information for a solution to be established. If a large number of runs are required, however, or if the model is too complex for manual operations, the whole program can be converted to computer operation very rapidly. The forms on which the entities and activities are described are designed for punching, and the resulting punched cards are input to the computer with the HOCUS software for any number of runs required. The program is written in Fortran computer language and is available for a number of different computers. The program can be run on computers with terminals, so that the designer can interact with the program, changing parameters so as to assess the effect of different decisions.
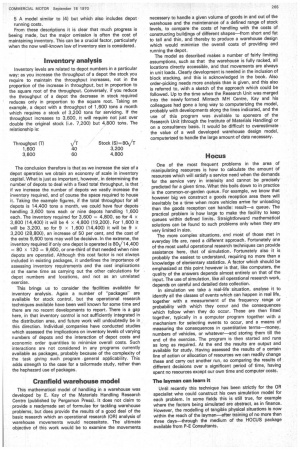
The next diagrams illustrate an application of the package; the first shows the physical situation being studied: a warehouse site with restricted access.
The second chart (foot of page) is the HOCUS logic chart of the entities and states.
Further Reading F. WENTWORTH (Ed): Physical Distribution Management (Gower Press 1970).
J. E. SUSSAMS: Industrial Logistics (Gower Press 1970).
E. KA Y: A Mathematical Model for handling in a Warehouse (Pergamon Press 1968).