


THE AT-A-GLANCE EFFICIENCY CHART.
Page 14
Page 16
If you've noticed an error in this article please click here to report it so we can fix it.
A New Device, Remarkable for its Simplicity and the Ease With Which the Records Upon It May be Read and Compared
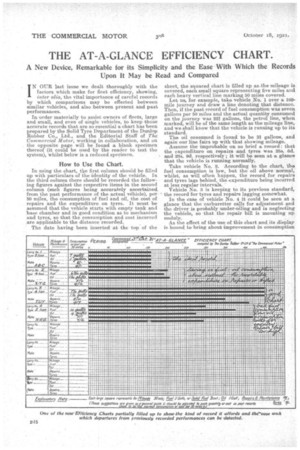
IN OUR last issue we dealt thoroughly with the factors which make for fleet efficiency, showing, inter alia, the vital importance of careful records by which comparisons may be effected between similar vehicles, and also, between present and past performances.
In order materially to assist owners of fleets, large and small, and even of .single vehicles, to keep those accurate records that are so essential a, chart has been prepared by the Solid Tyre Department Of the Dunlop Rubber Co., Ltd., and the Editorial Staff of The Commercial Motor, working in collaboration. and on the opposite page will be found a blank specimen thereof (it could be used by the reader to test the system), whilst below is a reduced specimen.
How to Use the Chart.
In using the chart, tbe first column should be filled up with particulars of the identity of the vehicle. In the third column there should be recorded the following figures against the respective items in the second column (such figures being accurately ascertained From the past performance of the actual vehicle), per 50 miles the consumption of fuel and oil, the cost of repairs and the expenditure on tyres. It must be assumed that the vehicle starts with empty tank and base chamber and in good condition as to mechanism and tyre, so that the consumption and cost incurred are applicable to the distance recorded., .
• The date having been insertedat the top of the
sheet, the squared chart is filled up as. the mileage is covered, each small square representing five miles and each heavy vertical line marking 50 miles covered. Let us, for example, take vehicle No. 1 over a 160mile journey and draw a line denoting that distance. Then, if the past record of fuel consumption was seven gallons per 50 Miles and the actual quantity consumed on the journey was 221 gallons, the petrol line, when marked, will be of the same length as the mileage tine, and we shall know that the vehicle is running up to its standard.
The oil consumed is found to be n gallons, and again our line fairs up with that showing mileage.
Assume .the improbable on so brief a record : that the expenditure on repairs and tyres was 25s. -6d. and .28s. 9d. respectively ; it will be seen at a glance that the vehicle is running normally.
Take vehicle No. 2. According to the chart, the fuel consumption is low, but the oil above normal, whilst; as will often happen, the record for repairs and tyres lags behind, the expenditure being incurred at less regular intervals. Vehicle No. 3 is keeping to its previous standard, ' the record for tyres and repairs lagging somewhat.
In the -cabe of vehicle No. 4 it could be seen at a glance that the carburetter calls for adjustment and the. driver is probably !under-oiling and is neglecting the vehicle, so that the repair bill is mounting up unduly. As the effect of the. use. of. this chart and its display is bound to bring about improvement in consumption and greater care resulting in reduced costs, it will gradually be found that the figures appearing in column three, forming the basis, are becoming too high, and they should be adjusted from time to time, the opportunity being taken when a new sheet is being started, the new figures being written in red on the first sheet upon which they are employed. A good way would then be to keep red ink for that particular set of figures, at the next change black tiik being again used. Thus, in turning back over the sheets containing past records, it would readily be seen when the adjustments were made and over what periods the adjusted figures were employed. Should the chart be used for a single vehicle, the indicating lines should be continued from one set of spaces to the next, so that the sheet serves for a total mileage of 4,000. lf
the performances of two, three, or four vehicles he recorded on one sheet, the sheet should be divided by heavier horizontal lines into sections so that it serves two vehicles for 2,000 miles each and three or four vehicles for 1,000 miles each. Eight vehicles is, of course, the largest number that can be dealt with on a sheet, so that, for a fleet of 40 vehicles, five sheets
would need to be in use. • These charts for eight vehicles can: be obtained on separate sheets, 9-1 ins. by 6;', ins. They may be bound in a book, kept separate in a file, ar pasted on a card. They are published by The Commercial Motor, 745, Eosebery Avenue, London, E.C. 1, at Ss. per 100, 4s. per 50, and 25. per 25, post free. The Dunlop Rubber Co., Ltd., refer to this chart in a useful brochure on solid tY'res.