


From the Elkawiriq Bor
Page 40
Page 41
If you've noticed an error in this article please click here to report it so we can fix it.
e
by Graham Montgomerie With energy at an ever-increasing premium, the power needed tc overcome air drag resistance is the subject of much research. But ar aerodynamically designed cab is not really an adequate answer to thi problem.
-IE EFFECT of air drag on fuel insumption is receiving a lot of tention from manufacturers id operators alike. Certainly, speeds increase, the power eded to overcome aerodyimic resistance becomes a ore significant factor.
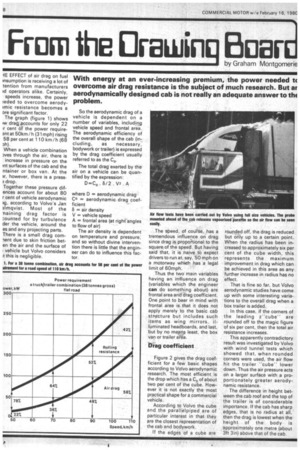
The graph (figure 1) shows iw dragnaccounts for only 22 ,r cent di the power requireant at 50km / h (31 mph) rising 58 per cent at 110 km /h (68 ph).
When a vehiclecombination Pves through the air, there is increase in pressure on the int surfaces of the cab and the ntainer or box van. At the ir, however, there is a press3 drop.
Together these pressure difences account for about 80 r cent of vehicle aerodynamic )g, according to Volvo's Jan )Imqvist. Most of the 'naming drag factor is :ounted for by turbulence der the vehicle, around the es and any projecting parts. There is a small drag com'lent due to skin friction beten the air and the surface of vehicle but Volvo considers It this is negligible. So the aerodynamic drag of a vehicle is dependent on a number of variables, including vehicle speed and frontal area. The aerodynamic efficiency of the overall shape of the cab (in
cluding, as necessary, bodywork or trailer) is expressed by the drag coefficient usually referred to as the C0.
The total drag exerted by the air on a vehicle can be quantified by the expression:
D=C,, . 8/2 . V2 . A where D = aerodynamic drag C° = aerodynamic drag coefficient
8 = air density V = vehicle speed A = frontal area (at right angles to flow of air) The air density is dependent on temperature and pressure; and so without divine intervention there is little that the engineer can do to influence this factor. The speed, of course, has a tremendous influence on drag since drag is proportional to the square of the speed. But having said that, it is naive to expect drivers to run at, say, 50 mph on a motorway which has a legal limit of 60mph.
Thus the two main variables having an influence on drag (variables which the engineer can do something about) are frontal area and drag coefficient. One point to bear in mind with frontal area is that it does not apply merely to the basic cab structure but includes such items as wing mirrors, illuminated headboards, and last, but by no means least, the box van or trailer area.
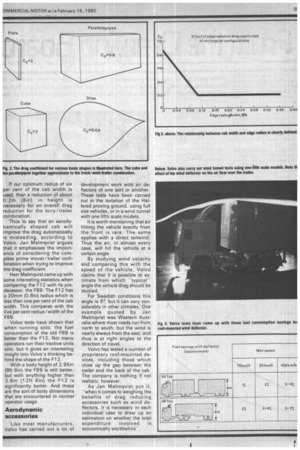
Drag coefficient Figure 2 gives the drag coefficient for a few basic shapes according to Volvo aerodynamic research. The most efficient is the drop which has a Cr, of about two per cent of the cube. However it is not exactly the most practical shape for a commercial vehicle.
According to Volvo the cube and the parallelpiped are of particular interest in that they are the closest representation of the cab and bodywork.
If the edges of a cube are rounded off, the drag is reduced but only up to a certain point. When the radius has been increased to approximately six per cent of the cube width, this represents the maximum improvement in drag which can be achieved in this area as any further increase in radius has no effect.
That is fine so far, but Volvo aerodynamic studies have come up with some interesting variations to the overall drag when a box trailer is added.
In this case, if the corners of the leading 7"cube" are rounded off to the magic figure of six per cent, then the total air resistance increases.
This apparently contradictory result was investigated by Volvo with wind tunnel tests which showed that, when rounded corners were used, the air flow hit the trailer "cube" lower down. Thus the air pressure acts on a larger surface with a proportionately greater aerodynamic resistance.
The difference in height between the cab roof and the top of the trailer is of considerable importance. If the cab has sharp edges, that is no radius at all, then the drag is lowest when the height of the body is approximately one metre (about 3ft 3in) above that of the cab. If our optimum radius of six per cent of the cab width is used, then a reduction of about 0.2m (8in) in height is necessary for an overall drag reduction for the lorry/trailer combination.
Thus to say that an aerodynamically shaped cab will improve the drag automatically is misleading, according to Volvo. Jan Malmqvist argues that it emphasises the importance of considering the complete prime mover/trailer cornbination when trying to improve the drag coefficient.
Herr Malmqvist came up with some interesting statistics when comparing the F12 with its predecessor, the F89. The F12 has a 20mm (0.8in) radius which is less than one per cent of the cab width. This compares with the five per cent radius/width of the F89.
Volvo tests have shown that when running solo, the fuel consumption of the old F89 is better than the F12. Not many operators run their tractive units solo, but it gives an interesting insight into Volvo's thinking behind the shape of the F12.
With a body height of 2.95m (9ft 8in) the F89 is still better, but with anything higher than 3.8m (12ft 6in) the F12 is significantly better. And these are the sort of body dimensions that are encountered in normal operator usage.
Aerodynamic accessories
Like most manufacturers, Volvo has carried out a lot of development work with air deflectors of one sort or another. These tests have been carried out in the isolation of the Haltered proving ground, using full size vehicles, or in a wind tunnel with one fifth scale models.
It is worth mentioning that air hitting the vehicle exactly from the front is rare. The same applies with a direct tailwind. Thus the air, in almost every case, will hit the vehicle at a certain angle.
By studying wind velocity and comparing this with the speed of the-vehicle, Volvo claims that it is possible to estimate from which -typicalangle the vehicle drag should be studied.
For Swedish conditions this angle is 6!"', but it can vary considerably in other climates. One example quoted by Jan Malmqvist was Western Australia where most roads run from north to south; but the wind is nearly always from the east, and thus is at right angles to the direction of travel.
Volvo has tested a number of proprietary roof-mounted devices, including those which close up the gap between the trailer and the back of the cab. The company is nothing if not realistic, however.
As Jan Malmqvist put it, "when it comes to weighing the benefits of drag reducing accessories such as wind deflectors, it is necessary in each individual case to draw up an estimation on whether the total
expenditure involved is economically worthwhile-.