INTERPRETING -THI 4AKER'S PERFORMANCE DATA
Page 32

Page 33

If you've noticed an error in this article please click here to report it so we can fix it.
WHEN considering the choice of a new vehicle, operators do not always give sufficient consideration to the engine-performance MIMS which the maker usually provides in his catalogue or on his data sheets. The assumption is often made that, provided the vehicle be suitable as regards its capacity and certain other esseatials, the maker will ensure that it is adequately powered and capable of achieving a reasonable fuel consumption. However, when comparing vehicles of similar type, a study of the performance graphs will often reveal features that make it evident that one engine is likely to suit the operator's particular conditions better than another.
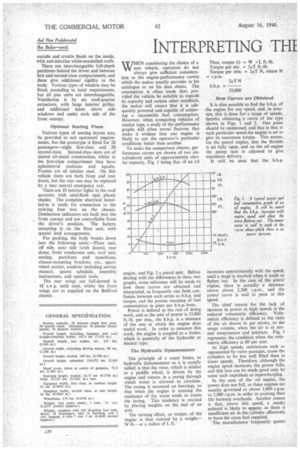
To make the comparison clearer, performance curves are shown of two sixcylindered units of approximately similar capacity, Fig. I being that of an oil
engine, and Fig. 2 a petrol unit. Before dealing with the differences in these two graphs, some reference will be made to how these curves are obtained and interpreted, as frequently one finds confusion between such terms as b.h.p. and torque, and the precise meaning of fuel consumption in pints per b.h.p.-hout.
Power is defined as the rate of doing work, and as the unit of power is 33,000 ft.-lb. per min., the b.h.p. is a measure of the rate at which the engine does useful work. In order to measure this .work, the engine is coupled to a brake, which is generally of the hydraulic or electric type.
The Hydraulic Dynamometer
The principle of a water brake, or hydraulic dynamometer as it is usually called,' is that the rotor, which is similar to a paddle wheel, is driven by the engine and rotates in a casing through which water is allowed to circulate. The casing is mounted on bearings, so that when the engine is running the resistance of the water tends to rotate the casing. This tendency is resisted by placing weights on the end of an arm.
The turning effort, or torque, of the engine is thus resisted by a weight— W tb.—at a radius of L ft. '
Thus, torque (t) = W x L ft.-lb. Torque per rev. us 271-T ft.-lb.
Torque per min. = 24rT N, where N r.p.m.
2x-T N b.h.p. = 33,000 How Curves are Obtained
It is thus possible to find the b.h.p. of the engine for any speed, and, in practice, this is done for a range of speeds, thereby obtaining a curve of the type shown in Figs. 1 and 2. One point should be mentioned, and that is that at each particular speed the engine is set to give its maximum torque. This means, for the petrol engine, that the throttle is set fully open, and on the oil engine the pump rack is adjusted to give maximum delivery.
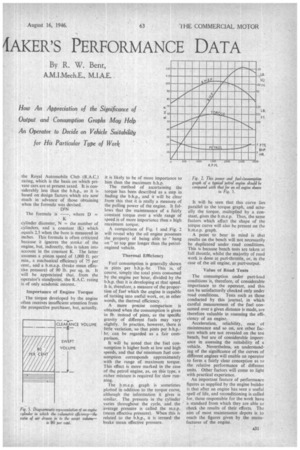
It will be seen that the b.h.p.
increases approximately with the speed, until a stage is reached when it tends to flatten out. In the case of the petrol engine, there is actually a decrease above about 2,500 r.p.m., and the power curve is said to peak at this speed.
• The chief reason for the lack of increase in power at high speeds is the reduced volumetric efficiency. Volumetric efficiency is defined as the ratio of the air drawn in per stroke, to the swept volume, when the air is at normal temperature and pressure. Fig. 3 represents the condition when the volumetric efficiency is 80 per cent.
At high speeds, restrictions such as represented by valve passages, cause the cylinders to be less well filled than at lower speeds. Therefore, although the engine speed increases, the power falls, and this loss can be made good only by some such expedient as supercharging.
In the case of the oil engine, the power does not fall, as these engines are usually • governed to about 1,800 r.p.m. to 2,000 r.p.m. in order to prolong their life between overhauls. Another reason is that, above this speed, a smoky exhaust is likely to appear, as there is insufficient air in the cylinder effectively to burn the extra fuel supplied.
The manufacturer frequently quotes the Royal Automobile Club (R.A.C.) rating, which is the basis on which private cars are at present taxed. It is considerably less than the b.h.p., as it is based on design factors which are now much in advance of those obtaining when the formula was devised.
132N
The formula is —, where D = • K cylinder diameter, N = the number of cylinders, and a constant (K) which equals 2.5 when the bore is measured in inches. This formula is often criticized because it ignores the stroke of the engine, but, indirectly, this is taken into account in the constant K. The latter assumes a piston speed of 1,000 ft. per min., a mechanical efficiency of 75 per cent., and a b.m.e.p. (brake mean effective pressure) of 90 lb. per sq. in. It will be appreciated that, from the operator's standpoint, the R.A.C. rating is of only academic interest., Importance of Engine Torque The torque developed by the engine often receives insufficient attention from the prospective purchaser, but, actually.
Fig. 3. Diagrammatic representation of an engine cylinder in which the columeiric effirieney--the ratio of air drawn in to the swept volume— is 80 per cent.
it is likely to be of more importance to him than the maximum b.h.p. The method of ascertaining the torque has been described as a step in finding the b.h.p., and it will be clear from this that it is really a measure of the pulling power of the engine. It follows that the maintenance of a fairly constant torque over a wide range of speed is of more importance than a high maximum torque.
A comparison of Fig. 1 and Fig. 2 will reveal why the oil engine possesses the property of being able to hang on" to top gear longer than the petrolengined vehicle.
Thermal E1ficlenc3
Fuel consumption is generally shown in pints per b.h.p.-hr. This is, of course, simply the total pints consumed by the engine per hour, divided by the b.h.p. that it is developing at that speed. It is, therefore, a measure of the proportion of fuel which the engine is capable of turning into useful work, or, in other words, the thermal efficiency.
A more precise comparison is obtained when the consumption is given in lb. instead of pints, as the specific gravity of different fuels may vary slightly. In practice, however, there is little variation, so that pints per b.h.p.hr. can be regarded as a fair comparison.
It will be noted that the fuel consumption is higher both at low and high speeds, and that the' minimum fuel consumption corresponds approximately with the range of maximum torque. This effect is more marked in the case of the petrol engine, as, on this type, a richer mixture is required for slow running.
The b.m.e.p. graph is sometimes plotted in addition to the torque curve, although the information it gives is similar. The pressure in the cylinder varies throughout the cycle, and the average pressure is called the m.e.p. (mean effective pressure). When this is related to the b.h.p., it is termed the brake mean effective pressure.
It will be seen that this curve lies parallel to the torque graph, and actually the torque, multiplied by a constant, gives the b.m.e.p. Thus, the same factors which affect the shape of the torque curve will also be present on the b.m.e.p. graph.
A point to bear in mind is that results on the bench will not necessarily be duplicated under road conditions. This is because bench tests are taken at full throttle, whilst the majority of road work is done at part-throttle, or, in the case of the oil engine, at part-output.
Value of Road Tests The consumption under part-load conditions is, therefore, of considerable importance to the operator, and this can be satisfactorily checked only under road conditions. Tests such as those conducted by this journal, in which careful measurement of the fuel consumed over a given distance is made, are therefore valuable in assessing the efficiency of an engine.
Acceleration, reliability, ease of maintenance and so on, are other factors which are not revealed on the test bench, but are of considerable importance in assessing the suitability of a vehicle. Nevertheless, an understanding of the significance of the curves of different engines will enable an operator to form a fairly clear conception as to the relative performance of different units. Other factors will come to light with practical experience.
An important feature of performance figures as supplied by the engine builder is that after an engine has seen a useful spell of life, and reconditioning is called for, those responsible for the work have a standard from which they are able to check the results of their efforts. The aim of most maintenance depots is to reach the figures given by the manufacturer of the engine.


