ANSITION AGE
Page 103

Page 104

Page 105

Page 106

If you've noticed an error in this article please click here to report it so we can fix it.
in Systems of
MUNICIPAL
PASSENGER CARRYING
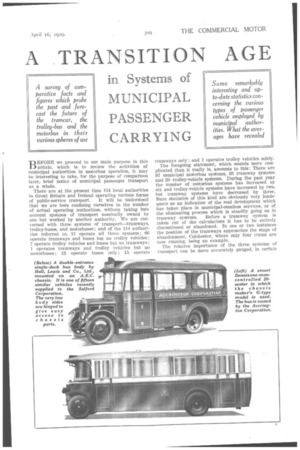
BEFORE we proceed to our main purpose in this article, which is to review the activities of municipal authorities in motorbus operation, it may he interesting to take, for the purpose of comparison later, brief notice of municipal passenger transport as a whole.
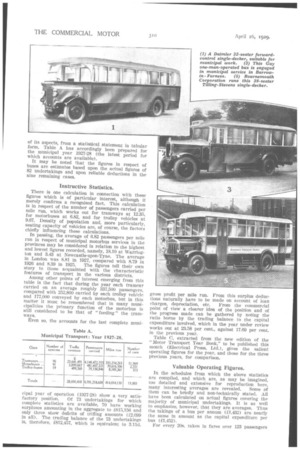
There are at the present time 114 local authorities in Great Britain and Ireland operating various forms of public-service transport. It will be understood that we are here confining ourselves to the number of actual operating authorities, without taking into account systems of transport nominally owned by one but worked by another authority. We are concerned with three systems of transport—tramways, trolley-buses, and motorbuses; and of the 114 authorities referred to, 11 operate all three systems; 66 operate tramways and buses but DO trolley vehicles; 7 operate trolley vehicles and buses but no tramways; 1 operates tramways and trolley vehicles hut no motorbuses; 13 'operate buses only; 15 operate tramways only ; and 1 operates trolley vehicles solely. The foregoing statement, which sounds more complicated than it really is, amounts to this: There are 97 municipal motorbus systems, 93 tramway systems and 20 trolley-vehicle systems. During the past year the number of motorbus systems has increased by six and trolley-vehicle systems have increased by two, hut tramway systems have decreased by three. Bare statistics of this kind are obviously very inadequate as an indication of the real development which has taken place in municipal-omnibus services, or of the eliminating process which is steadily going on in tramway systems. Before a tramway system is taken out of the calculations it has to be entirely discontinued or abandoned. In one or two instances the position of the tramways approaches the stage of abandonment, Colchester, where only four trams are now running, being an example. The relative importance of the three systems of transport can be more accurately gauged, in certain of its aspects, from a statistical statement in tabular form. Table A has accordingly been prepared for the municipal year 1927-28 (the latest period for which accounts are available).
It may be noted that the figures in respect of buses are estimates based upon the actual figures of 82 undertakings and upon reliable deductions in the nine remaining cases.
Instructive Statistics.
There is one calculation in connection with these figures which is of particular interest, although it merely confirms a recognised fact. This calculation is in respect of the number of passengers carried per mile run, which works out for tramways at 12.35, for motorbuses at 6.82, and for trolley vehicles at 9.67. Density of population and, more particularly, seating capacity of vehicles are, of course, the factors chiefly influencing these calculations.
In passing, the average of 6.82 passengers per mile run in respect of municipal motorbus services in the provinces may be considered in relation to the highest and lowest figures recorded, namely, 18.10 at Warrington and 3.43 at Newcastle-upon-Tyne. The average in London was 8.81 in 1927, compared with 8.79 in 1926 and 8.39 in 1925. The figures tell their own story to those acquainted with the characteristic features of transport in the various districts.
Among other points of interest emerging from this table is the fact that during the year each tramcar carried on an average roughly 337,500 passengers, compared with 252,800 carried by each trolley vehicle and 177,000 conveyed by each motorbus, but in this matter it must be remembered that in many municipalities the primary function of the motorbus is still considered to be that of "feeding" the tramways.
Even so, the accounts for the last complete muni cipal year of operation (1927-28) show a very satis factory position. Of 73 undertakings for which complete statistics are available, 70 have working surpluses amounting in the aggregate to £815,156 and only three show deficits of trifling amounts (12699 in all). The trading balance of the 73 undertakings is, therefore, £812,457, which is equivalent to 3.11d. gross profit per mile run. From this surplus deductions naturally have to be made on account of loan charges, depreciation, etc. From the commercial point of view a clearer idea of the position and of the progress made can be gathered by noting the ratio borne by the trading balance to the capital expenditure involved, which in the year under review works out at 23.58 per cent., against 17.69 per cent. in the previous year.
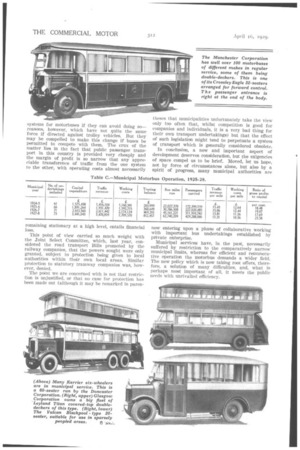
Table C, extracted from the new edition of the "Motor Transport Year Book," to be published this month (Electrical Press, Ltd.), gives the salient operating figures for the year, and those for the three previous years, for comparison.
Valuable Operating Figures.
In the schedules from which the above statistics are compiled, and which are, as may be imagined, too detailed and extensive for reproduction here, many interesting averages are revealed. Some of them can be briefly and non-technically stated. All have been calculated on actual figures covering the majority of municipal undertakings. It is as well to emphasize, however, that they are averages. Thus the takings of a bus per annum (£1,432) are nearly the same in amount as the capital expenditure per bus (£1,452).
For every 20s. taken in fares over 123 passengers
had to be carried; in other words, the average fare paid per passenger was 1.94d.; also for every 20s. taken in fares the buses had to run over 18 miles, which fact is otherwise expressed by the figures in the above table of 13.31d. traffic revenue per mile run. Of the total revenue, 76.93 per cent, was paid away in working costs.
Working Cost Averages.
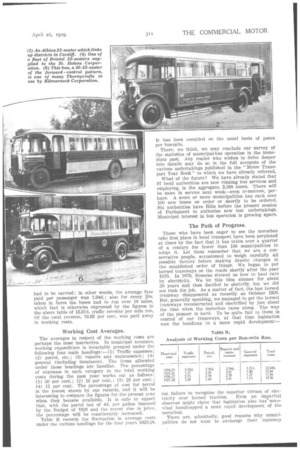
The averages in respect of the working costs are perhaps the most instructive. In municipal accounts, working expenditure is invariably grouped under the following four main headings:—(1) Traffic expenses; (2) petrol, etc.; (3) repairs and maintenance; (4) general (including insurance). The items allocated under these headings are familiar. The percentage of expenses in each category to the total working costs during the past year works out as follows: (1) 50 per cent.; (2) 16 per cent.; (3) 23 per cent.; (4) 11 per cent. The percentage of cost for petrol is the lowest shown by our records, and it will be interesting to compare the figures for the present year when they become available. It is safe to expect that, with the petrol tax of 4d. per gallon imposed by the Budget of 1928 and the recent rise in price, the percentage will he considerably increased.
Table B records the fluctuation in average costs under the various headings for the four years 1925-28.
It has been compiled on the usual basis of pence per bus-mile.
There, we think, we may conclude our survey of the statistics of municipal-bus operation in the immediate past. Any reader who wishes to delve deeper into details may do so in the full accounts of the various undertakings published in the "Motor Transport Year Book" to which we have already referred.
What of the future? We have already stated that 97 local authorities are now running bus services and employing, in the aggregate, 3,568 buses. There will be more in service next week—even to-morrow, perhaps. A score or more municipalities has each over 100 new buses on order or shortly to be ordered. Six authorities have Bills before the present session of Parliament to authorize new bus undertakings. Municipal interest in bus operation is growing apace.
The Path of Progress.
Those who have been eager to see the motorbus take first place in local transport have been perplexed at times by the fact that it has taken over a quarter of a century for fewer than 100 municipalities to adopt it. Let them remember that we are a conservative people, accustomed to weigh carefully all possible factors before making drastic changes in the established order of things. We began to put horsed tramways on the roads shortly after the year 1870. In 1879, Siemens showed us how to haul cars by electricity. We let this idea simmer for about 20 years and then decided to electrify, but we did not rush the job. As a matter of fact, the last horsed tramway disappeared as recently as October 1926. But, generally speaking, we managed to get the horsed tramways reconstructed and electrified by just about the time when the motorbus came along. The way of the pioneer is hard. To be quite fair to those in control of our tramways, at that time legislation was the handicap to a more rapid development—
not failure to recognise the superior virtues of elec
tricity over horsed traction. Even an impartial observer might claim that legislation also has-somewhat handicapped a more rapid development of the motorbus.
There are, admittedly, good reasons why municipalities do not want to exchange their tramway systems for motorbuses if they can avoid doing so— reasons, however, which have not quite the same force if directed against trolley vehicles. But they may be compelled 0 make this change if buses be permitted to compete with them. The crux of the matter lies in the fact that public passenger transport in this country is provided very cheaply and the margin of profit is so narrow that any appreciable transference of traffic from the one system to the other, with operating costs almost necessarily remaining stationary at a high level, entails financial loss.
This point of view carried so much weight with the Joint Select Committee, which, last year, considered the road transport Bills promoted by the railway companies, that the powers sought were only granted, subject to protection being given to local authorities within their own local areas. Similar protection to statutory tramway companies was, however, 'denied.
The point we are concerned with is not that restriction is unjustified, or that no case for protection has been made out (although it may be remarked in paren
theses that municipalities unfortunately take the view only too often that, whilst competition is good for companies and individuals, it is a very bad thing for their own transport undertakings) but that the effect of such legislation might tend to perpetuate a system of transport which is generally considered obsolete.
In conclusion, a new and important aspect of development deserves consideration, but the exigencies of space compel us to be brief. Moved, let us hope, not by force of circumstances alone, but also by a spirit of progress, many municipal authorities are now entering upon a phase of collaborative working with important bus undertakings established by private enterprise.
Municipal services have, in the past, necessarily suffered by restriction to the comparatively narrow municipal limits, whereas for efficient and remunerative operation the motorbus demands a wider field. The new policy which is now taking root offers, therefore, a solution of many difficulties, and, what is perhaps most important of all, it meets the public needs with unrivalled efficiency.


