 1
1 2
2 3
3 4
4 5
5 6
6 7
7 8
8 9
9 10
10 11
11 12
12 13
13 14
14 15
15 16
16 17
17 18
18 19
19 20
20 21
21 22
22 23
23 24
24 25
25 26
26 27
27 28
28 29
29 30
30 31
31 32
32 33
33 34
34 35
35 36
36 37
37 38
38 39
39 40
40 41
41 42
42 43
43 44
44 45
45 46
46 47
47 48
48 49
49 50
50 51
51 52
52 53
53 54
54 55
55 56
56 57
57 58
58 59
59 60
60 61
61 62
62 63
63 64
64 65
65 66
66 67
67 68
68 69
69 70
70 71
71 72
72 73
73 74
74 75
75 76
76 77
77 78
78 79
79 80
80 81
81 82
82 83
83 84
84 85
85 86
86 87
87 88
88 89
89 90
90 91
91 92
92 93
93 94
94 95
95 96
96 97
97 98
98 99
99 100
100 101
101 102
102 103
103 104
104 105
105 106
106 107
107 108
108 109
109 110
110 111
111 112
112 113
113 114
114 115
115 116
116 117
117 118
118 119
119 120
120 121
121 122
122 123
123 124
124 125
125 126
126 127
127 128
128 129
129 130
130 131
131 132
132 133
133 134
134 135
135 136
136 Cost, Revenue
Page 90
Page 91
Page 92
If you've noticed an error in this article please click here to report it so we can fix it.
Keeping down the cost of operating a commercial vehicle to a minimum must be done with an eye to its revenue-earning capacity KNOWLEDGE of the principles underlying the costing of vehicle operation is a prerequisite to lasting success in haulage. I say lasting success deliberately because it is surprising how so many operators seemingly have few, if any, records of costs but nevertheless appear to get by, at least for the time being.
In contrast with this section of hauliers, the more prudent operators who do maintain adequate records nevertheless need to keep this exercise in perspective and bear in mind its relationship with the work actually done by the vehicles concerned.
A first indication of this relationship arises within the sphere of costing itself by the division of the total operating costs into standing and running costs. In the former case this group of costs continues to be incurred whether a vehicle is operated or not, whilst running costs arise directly in relation to mileage run.
Thus, as an example, the total standing cost for a five-tonner fitted with diesel engine and standard platform body is 18 7s. 9d. a week, while the corresponding running cost per mile, when averaging 200 miles a week, is 9.79d. This latter amount is reduced to 8.89d. a mile at 400 miles a week, or 8.73d. at 600 miles a week.
The explanation of this minor variation in running cost is twofold. Maintenance, which constitutes one of the five items of running cost, is itself made up to washing, servicing and major repairs. While it is considered that the proportion for major repairs is directly related to mileage run, it is common practice for many operators to wash and grease their vehicles weekly regardless of any variation in the mileage in any particular week. Hence the total maintenance cost reduces slightly as the weekly mileage increases. The second reason for the slight increase in the running cost as the weekly mileage falls below an average figure appropriate to the particular size of vehicle is because depreciation is calculated on a mileage basis. Accordingly, where the average weekly mileage is unusually low, then the replacement of that vehicle will be, in part, the result of obsolescence rather than solely wear and tear. An increase in the depreciation cost per mile is therefore made which is correspondingly reflected in the total running cost—in this case when applied to 200 miles per week.
But these slight variations in running costs with the average weekly mileage are minor compared with the variations in standing costs when shown as a cost per mile. So far it has been given as a weekly cost—namely, £18 7s. 9d. At 200 miles a week this is equivalent to 22.07d. a mile and correspondingly 11.03d. a mile at 400 miles a week, dropping still further to 7.36d. per mile at 600 miles a week.
Relative variation
The addition of standing costs and running costs therefore emphasizes the variation relative to differing weekly mileages. At 200 miles a week the total operating cost per mile provided by the addition of standing and running costs is 31.86d. At 400 miles a week it drops to 19.92d. and still further to 16.09d. at 600 miles a week. If the vehicle were more intensely operated the operating cost per mile would be reduced to 14.25d. at 800 miles a week, or 13.14d. at 1,000 miles a week.
Ignoring the exceptionally low average weekly mileage of 200, it will be seen that even at 400 miles a week—the equivalent of 80 miles a day for a five-day week—the total operating cost (19.92d. a mile) is more than 50 oer cent higher than the corresponding figure at 1,000 miles a week (13.I4d.).
Although it should be virtually self-evident the qualification must be made that when speaking of average weekly mileages in this context there is the implied acceptance that all such mileage is profitably operated. or whatever percentage of loading is achieved and accepted at the lower average weekly mileages is at least maintained as the mileage increases.
Just how such percentage loadings are achieved will vary substantially relative to the particular traffic carried or the extent to which a particular operator has been long established and therefore may possibly have the edge on his newer competitors as to return loading. Alternatively he may be in such a way of business that he can economically justify trunk running with collection-and-delivery vehicles at either end.
Average loadings With some types of traffic—tipping work and bulk liquid movement could be obvious examples—the maximum loading an operator can hope to achieve is 100 per cent outward and nil return, or 50 per cent overall. But in the field of general haulage there is substantial room for variation, and overall a figure of 75 per cent is often quoted as a common average. Relative to overall profitability it is immaterial whether this is achieved by 100 per cent outward and 50 per cent return or any other
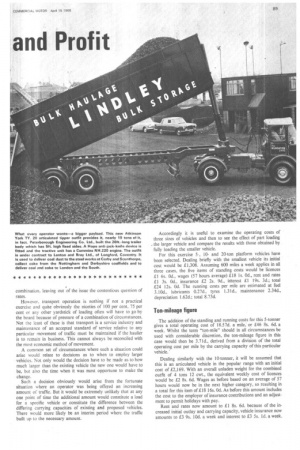
What every operator wants—a bigger payload. This new Atkinson York TV. 20 articulated tipper outfit provides it, nearly 19 tons of it, in fact. Peterborough Engineering Co. Ltd., built the 26ft.-long trailer body which has 5tt. high fixed sides. A Hope anti-jack-knife device is fitted and the tractive unit has a Cummins NH.220 engine. The outfit is under contract to Lenton and Bray Ltd., of Longford. Coventry. It is used to deliver coal dust to the steel works at Corby and Scunthorpe, collect coke from the Nottingham and Derbyshire coalfields and to deliver coal and coke to London and the South.
combination, leaving out of the issue the contentious question of rates.
However, transport operation is nothing if not a practical exercise and quite obviously the niceties of 100 per cent, 75 per cent or any other yardstick of loading often will have to go by the board because of pressure of a combination of circumstances. Not the least of these is that transport is a service industry and maintenance of an accepted standard of service relative to any particular movement of traffic must be maintained if the haulier is to remain in business. This cannot always be reconciled with the most economic method of movement.
A common set of circumstances where such a situation could arise would relate to decisions as to when to employ larger vehicles. Not only would the decision have to be made as to how much larger than the existing vehicle the new one would have to be, but also the time when it was most opportune to make the change.
Such a decision obviously would arise from the fortunate situation where an operator was being offered an increasing amount of traffic. But it would be extremely unlikely that at any one point of time the additional amount would constitute a load for a specific vehicle or constitute the difference between the differing carrying capacities of existing and proposed vehicles. There would more likely be an interim period where the traffic built up to the necessary amount. Accordingly it is useful to examine the operating costs of three sizes of vehicles and then to see the effect of part loading . the larger vehicle and compare the results with those obtained by fully loading the smaller vehicle.
For this exercise 5-, 10and 20-ton platform vehicles have been selected. Dealing briefly with the smallest vehicle its initial cost would be £1,308. Assuming 600 miles a week applies in all three cases, the five items of standing costs would be licences 1 fis. Od., wages (57 hours average) £18 Is. Od., rent and rates £1 3s. Od., insurance £2 2s. 9d., interest £1 19s. 3d.; total £24 12s. Od. The running costs per mile are estimated at fuel 3.10d.. lubricants 0.27d., tyres 1.31d.. maintenance 2.34d., depreciation 1.62d.; total 8.73d.
Ton-mileage figure
The addition of the standing and running costs for this 5-tonner gives a total operating cost of 18.57d. a mile,' or £46 8s. 6d. a week. Whilst the term "ton-mile" should in all circumstances be used with considerable discretion, the ton-mileage figure in this case would then be 3.71d., derived from a division of the total operating cost per mile by the carrying capacity of this particular vehicle.'
Dealing similarly with the 10-tonner, it will be assumed that this is an articulated vehicle in the popular range with an initial cost of £2,169. With an overall unladen weight for the combined outfit of 4 tons 12 cwt., the equivalent weekly cost of licences would be £2 8s. 6d. Wages as before based on an average of 57 hours would now be in the next higher category, so resulting in a total for this item of £18 16s. Od. As before this amount includes the cost to the employer of insurance contributions and an adjustment to permit holidays with pay.
Rent and rates now amount to £1 8s. 6d. because of the increased initial outlay and carrying capacity, vehicle insurance now amounts to £3 9s. 10d. a week and interest to £3 5s, ld, a week. This gives a total for the five items of standing costs for this 10tonner of £29 7s. 11d.
The five items of running cost per mile read: fuel 5.07d., lubricants 0.30d., tyres 2.42d., maintenance 3.13d., depreciation 2.27d; total 13.19d. As with the 5-tonner, tyre mileage is reckoned at 30,000 and vehicle life of 150,000.
The addition of standing and running costs gives a total operating cost for this 10-ton attic of 24.95d. per mile, or £62 7s. 5d. In round figures this gives a ton-mileage calculation of 2.50d.
Finally, the 20-tonner naturally would be in the quality range with a resulting initial outlay of £7,208. The five items of standing costs are estimated to be: licences £5 16s. 10d., wages £21 3s. 6d., rent and rates £1 15s. 3d., insurance £7 5s. id., interest £10 16s. 3d; total £46 16s. 11d. Similarly the five items of running cost per mile read: fuel 6.97d., lubricants 0.33d., tyres 4.54d., maintenance 4.40d., depreciation 4.08d; total 20.32d. This gives a total operating cost for the 20-ton attic of 39.06d. per mile, or £97 12s. lid, a week. The division of the total operating cost per mile by the carrying capacity gives a ton-mileage figure of 1.95d.
Recapping on the ton-mileage figures obtained these read: 5-tonner 3.71d., 10-tonner 2.50d. and 20-tonner 1.95d. Considering first the 5and 10-tonners, if instead of assuming maximum loading for the 10-tonner one divides the total operating cost per mile by the ton-mileage figure for the 5-tonner, a result of around 61 tons is obtained.
Here again, of course, this would in fact be an average-for example, 10 tons outward and 3+ on return. Obviously an operator would not purchase a larger vehicle with this objective in mind, but at least such a calculation could reassure him that he would have some margin to allow for the inevitable interim period when traffic was being built up from an average 5 tons to an ultimate 10 tons.
Doing the same exercise with the 10and 20-tonners, the division of the total operating cost per mile of 39.06d. a mile for the 20-tormer by the ton-mileage figure of 2.50d. for the 10-tonner gives a break-even loading figure for the 20-tonner of 15 tons 12 cwt. Once again such a calculation indicates the margin permitted to the operator when first using a larger vehicle until such time as he can build up sufficient custom to provide maximum loading.