


CHART A COURSE
Page 39
Page 40
If you've noticed an error in this article please click here to report it so we can fix it.
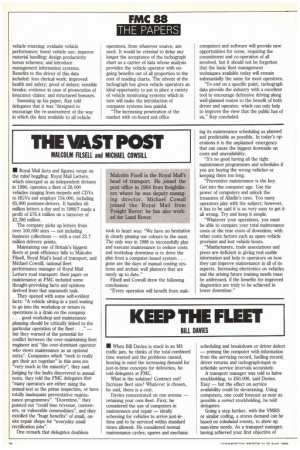
FRED KAY • Having summarised the background to the new generation of tachographs, Lucas Kienzle Instruments general manager Fred Kay told the conference: "Self diagnostic features are now included in the design which enable the user to know when either the battery has been disconnected or there has been power loss for whatever reason; he will also be able to ascertain if there is a fault in the road speed sensor or the cable run. There is now the opportunity to download tachograph data using, for example, a fibre optic in parallel with the normal recording on the circular chart."
In addition to formal chart analysis, Kay explained, "the chart is an indicator of aggressive or defensive driving . . . aggressive driving is where acceleration is rapid followed almost invariably by equally rapid deceleration as the driver fights the traffic conditions in an effort to make quicker progress. . . the wear and tear on engine, transmission, tyres and indeed on the driver himself are. . . enormous when this mode of driving is adopted".
With training, he added, "it's is relatively easy to recognise, using the speed trace, the difference between cross-country, motorway and urban routes. This will confirm that the driver did indeed follow the selected routes . . . "
The role of manual chart analysis "cannot be over-stated", said Kay, before moving on to describe more sophisticated tachographs that offer extra information such as engine speed records. "Used correctly, fuel savings of between five and 20% have been achieved," he reported.
The advantage of making proper use of tachograph data, said Kay, could allow the operator to: evaluate driving techniques; reduce maintenance costs; improve vehicle routeing; evaluate vehicle performance; boost vehicle use; improve material handling design productivity bonus schemes; and introduce management information systems. Benefits to the driver of this data included: less clerical work; improved health and safety; proof of delays; sensible breaks; evidence in case of prosecution of insurance claims; and structured bonuses.
Summing up his paper, Kay told delegates that it was "designed to encourage the re-assessment of the way in which the data available to all vehicle operators, from whatever source, are used. It would be criminal to delay any longer the acceptance of the tachograph chart as a carrier of data whose analysis provides the vehicle operator with ongoing benefits out of all proportion to the cost of reading charts. The advent of the tachograph has given vehicle operators an ideal opportunity to put in place a variety of vehicle monitoring systems which in turn will make the introduction of computer systems less painful.
"The increasing penetration of the market with on-board and office computers and software will provide new opportunities for some, requiring the commitment and co-operation of all involved, but it should not be forgotten that the basic fleet management techniques available today will remain substantially the same for most operators.
"To end on a specific point, tachograph data provide the industry with a excellent tool to encourage defensive driving along well-planned routes to the benefit of both driver and operator, which can only help to improve the view that the public has of us," Kay concluded.