 1
1 2
2 3
3 4
4 5
5 6
6 7
7 8
8 9
9 10
10 11
11 12
12 13
13 14
14 15
15 16
16 17
17 18
18 19
19 20
20 21
21 22
22 23
23 24
24 25
25 26
26 27
27 28
28 29
29 30
30 31
31 32
32 33
33 34
34 35
35 36
36 37
37 38
38 39
39 40
40 41
41 42
42 43
43 44
44 45
45 46
46 47
47 48
48 49
49 50
50 51
51 52
52 53
53 54
54 55
55 56
56 57
57 58
58 59
59 60
60 61
61 62
62 63
63 64
64 65
65 66
66 67
67 68
68 69
69 70
70 71
71 72
72 73
73 74
74 75
75 76
76 77
77 78
78 79
79 80
80 81
81 82
82 83
83 84
84 85
85 86
86 87
87 88
88 89
89 90
90 91
91 92
92 93
93 94
94 95
95 96
96 97
97 98
98 99
99 100
100 101
101 102
102 103
103 104
104 105
105 106
106 107
107 108
108 109
109 110
110 111
111 112
112 113
113 114
114 115
115 116
116 117
117 118
118 119
119 120
120 121
121 122
122 123
123 124
124 125
125 126
126 127
127 128
128 129
129 130
130 131
131 132
132 133
133 134
134 135
135 136
136 137
137 138
138 139
139 140
140 141
141 142
142 143
143 144
144 145
145 146
146 147
147 148
148 149
149 150
150 151
151 152
152 153
153 154
154 The Tram on its Last Legs
Page 94
Page 95
If you've noticed an error in this article please click here to report it so we can fix it.
MUNICIPAL enterprise in the provision of passenger-transport facilities is a subject of constant interest. At the present time there are over 100 authorities directly operating some form of local transport, and 96 of them run motorbuses. A number runs trolleybuses and tramcars as well but few authorities
now attempt to satisfy the transport requirements of their districts without the motorbus.
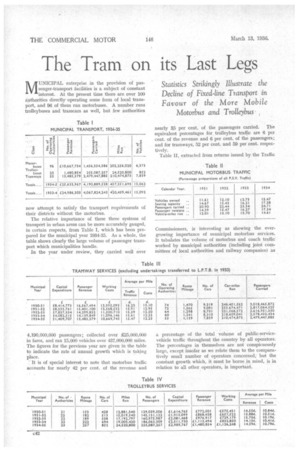
The relative importance of these three systems of transport in urban areas can be more accurately gauged, in certain respects, from Table I, which has been prepared for the municipal year 1934-35. As a whole, the table shows clearly the large volume of passenger transport which municipalities handle.
In the year under review, they carried well over 4,190,000,000 passengers; collected over £25,000,000 in fares, and ran 15,000 vehicles over 437,000,000 miles. The figures for the previous year are given in the table to indicate the rate of annual growth which is taking place.
It is of special interest to note that motorbus traffic accounts for nearly 42 per cent, of the revenue and nearly 35 per cent. of the passengers carried. The equivalent percentages for trolleybus traffic are 6 per cent. of the revenue and 6 per cent. of the passengers; and for tramways, 52 per cent. and 59 per cent. respectively.
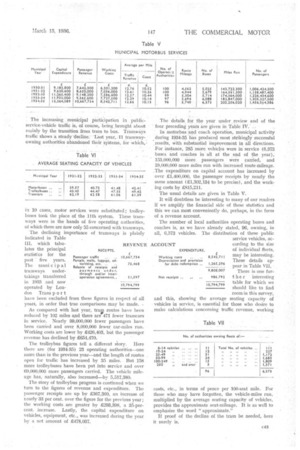
Table II, extracted from returns issued by the Traffic Commissioners, is interesting as showing the evergrowing importance of municipal motorbus services. It tabulates the volume of motorbus and coach traffic worked by municipal authorities (including joint committees of local authorities and railway companies) as a percentage of the total volume of public-servicevehicle traffic throughout the country by all operators. The percentages in themselves are not conspicuously large, except insofar as we relate them to the comparatively small number of operators concerned, but the constant growth which, it must be borne in mind, is in relation to all other operators, is important. . The increasing municipal 'participation in . public
service-vehicle traffic is, of course, being .brought about mainly by the transition from tram to bus. Tramways traffic shows a steacly-rdecline: 'Last year, -11 tramwayowning authorities abandoned their systems,for Which,
in 10 cases, motor services were substituted ; trolleybuses took the place of the 11th system. These tramways were in the hands of live operating authorities, of which there are now only 55 concerned with tramways.
The declining importance of tramways is plainly indicated in Table
III, which tabulates the principal
statistics for the
past five years.
The mum c ip al tramways under takings transferred in 1933 and now by Lonoperated
don Trans port have been excluded from these figures in respect of all years, in order that true comparisons may be made.
As compared with last year, tram routes have been reduced by 102 miles and there are 471 fewer tramcars in service. Nearly 98,000,000 fewer passengers have been carried and over 8,000,000 fewer car-miles run. Working costs are lower by £426,403, but the pasSenger revenue has declined by £654,470..
The trolleybus figures tell a different story. Here there are (for 1934-35) 23 operating authorities—one more than in the previous year—and the length of routes open for traffic has increased by 35 miles. But 158 more trolleybuses have been put into service and over 69,000,000 more passengers carried. The vehicle mileage has, naturally, also increased—by 5,517,380.
The story of trolleybus progress is continued when we turn to the figures of revenue and expenditure. The passenger receipts are up by 067,360, an increase of nearly 33 per cent. over the figure for the previous year ; the working costs are greater by £293,398, a 35-percent. increase. Lastly, the capital expenditure on vehicles, equipment, etc., was increased during the year by a net amount of £478,037.
The details for the year under, ,review and of the " four preceding years are given in Table IV.'
In motorbus and coach opera-6n, municipal activity during 1934-35 has produced most strikingly successful ,results, with substantial improvement in all directions. For instance, 285 more vehicles were in service (6,373 buses and coaches in all at the end of the year). 153,000,000 more passengers were carried, and 19,000,000 more Miles run with increased route-mileage. The expenditure on capital account has increased by over £1,400,000, the passenger receipts by nearly the same amount (£1,302,134 to be precise), and the working costs by £815,211.
The usual details are given in Table V.
It will doubtless be interesting to many of our readers if we amplify the financial side of these statistics and this we can most conveniently do, perhaps, in the form of a revenue account.
The number of local authorities operating buses and coaches is, as we have already stated, 96, owning, in all, 6,373 vehicles. The distribution of these public service vehicles, according to the size of individual fleets, may be interesting. These details appear in Table VII.
There is. one further interesting table for which we should like to find room in this survey, and this, showing the average seating capacity of • vehicles in service, is essential for those who desire to make calculations concerning traffic revenue, working
Net receipts ..
10.794,799
costs, etc., in terms of pence per 100-seat mile. For those who may have forgotten, the vehicle-miles run, multiplied by the average seating capacity of vehicles, provides the approximate seat-mileage. It is as well to emphasize the word "approximate."
If proof of the decline of the tram be needed, here it surely is.