 1
1 2
2 3
3 4
4 5
5 6
6 7
7 8
8 9
9 10
10 11
11 12
12 13
13 14
14 15
15 16
16 17
17 18
18 19
19 20
20 21
21 22
22 23
23 24
24 25
25 26
26 27
27 28
28 29
29 30
30 31
31 32
32 33
33 34
34 35
35 36
36 37
37 38
38 39
39 40
40 41
41 42
42 43
43 44
44 45
45 46
46 47
47 48
48 49
49 50
50 51
51 52
52 53
53 54
54 55
55 56
56 57
57 58
58 59
59 60
60 61
61 62
62 63
63 64
64 65
65 66
66 67
67 68
68 69
69 70
70 71
71 72
72 73
73 74
74 75
75 76
76 77
77 78
78 79
79 80
80 81
81 82
82 83
83 84
84 85
85 86
86 87
87 88
88 89
89 90
90 91
91 92
92 93
93 94
94 95
95 96
96 97
97 98
98 99
99 100
100 101
101 102
102 103
103 104
104 105
105 106
106 107
107 108
108 109
109 110
110 111
111 112
112 113
113 114
114 115
115 116
116 117
117 118
118 119
119 120
120 121
121 122
122 123
123 124
124 125
125 126
126 127
127 128
128 129
129 130
130 131
131 132
132 133
133 134
134 135
135 136
136 137
137 138
138 139
139 140
140 141
141 142
142 143
143 144
144 145
145 146
146 147
147 148
148 The Industry's Destiny as Told by Facts and Figures
Page 80
Page 81
If you've noticed an error in this article please click here to report it so we can fix it.
What the Latest Statistics Show in the Fields of Passenger Vehicle Service and Goods Carrying
FOR some psychological reason, everyone feels that the beginning of a New Year is the proper time to " take stock "-to look back appraisingly over the past, and forward, hopefully, into the future. On this occasion, convention fits in nicely with convenience, for the Ministry of Transport has just issued the Seventh Annual Reports of the Traffic Commissioners, from which much valuable information may be gleaned. They are dealt with elsewhere in this issue.
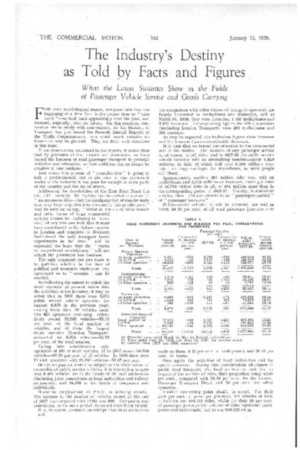
ROAD PASSENGER
Class of andOVar
port..
PUBLIC SERVICE VEHICLES: lel Local authorities (b) L.P.T.B.
(C) Other operators ..
Totals TROLLEYBUSES: (a) Local authorities IC) L.P,T,B.
(e) Other operators ...
Totals ••• TnAm.waYs: (a) Local authorities (b) L.P.T.B. to) Other operators ...
Totals ...
TOTAL (all classes of transport). Local authorities L.P.T.E.
Other operators Totals
From observations contained in the reports, it seems clear that by processes of law, finance and economics, we have barred the business of road passenger transport to personal initiative and enterprise, so that ambition can no longer be creative in new ventures.
Just where this process of " consolidation " is going to halt is problematical, . but in the view of, one prominent leader of the industry it has gone far enough in some parts of the country and too far in others.
Addressing the shareholders of the East Kent Road Car Co., Ltd., recently, Mr. Sydney Garcke called attention to " an erroneous idea-that the amalgamation of smaller units , into very large organizations necessarily brings efficiency." And he went on to say, " While all the ills of State boards and other forms of large commercial activity cannot be attributed to ' oversize,' at any rate one feels that it must have contributed to the failure-partial in London and complete in Northern Ireland-of the only transport board experiments so far tried," and he expressed the hope that the " mania for magnificent unwieldiness " will not attack the provincial bus business.
The only comment one can make is to question whether in the face of political and economic tendencies, any agreement as to "oversize " . can be reached.
As indicating the extent to which the small operator at present enters into the activities of the industry, it may be -noted that in 1937 there were 4,371 public service vehicle operators (as against 4,619 in the previous year) owning fewer than 10 vehicles each. The 427 operators remaining, collectively owned 38,828 vehicles-78.33 per cent. of the total number of vehicles, and of these the largest single operator (London Transport) accounted for 6,305 vehicles-12.72 per cent, of the total number.
Taking into consideration only operators of 100 or more vehicles, 77 in 1937 owned 30,030 vehicles-60.58 per cent, of all vehicles. In 1936 there were 71 such operators with 28,185 vehicles-58.65 per cent.
Before we pass on from this subject of the distribution of ownership of public service vehicles, it is interesting to note that 8,431 vehicles are in the hands of 95 local authorities (including joint committees of local authorities and railway companies), and 34,838 in the hands of companies and individuals.
Municipal employment of P.S.V. is growing rapidly. The increase in the number of vehicles owned at the end of 1937 (as compared with 1936) was 090. Companies and individuals, in the same period, increased their fleets by 843.
It is, of course, common knowledge that local authorities (in comparison with other classes of transport operator) are largely interested in trolleybuses and tramways, and at March 31, 1938, they were operating 1,359 trolleybuses and 6,825 tramcars. Corresponding figures for other operators (excluding London Transport) were 200 trolleybuses and 382 tramcars.
As may be expected, the trolleybus figures show increases and the tramcar figures considerable decreases.
It is time that we turned our attention to the commercial side of the matter. The business of any passenger service is, of course, to sell rides, and in 1937-38 the public service vehicle industry sold an astonishing .number-about 6,828 millions, in fact, of which well over 6,500 millions were taken on stage carriages (or motorbuses, as most people call them).
Approximately another 865 million rides were sold on trolleybuses and 3,059 millions on tramcars, making a total of 10,752 million rides in all, or 454 million more than in or corresponding period of 1936-37. Usually, in statistical articles, these rides are referred to as " passengers carried or " passenger journeys."
Public-service vehicles, it will be observed, are well in front; 63.50 per cent, of all road passenger journeys were
made on them, 8.05 per cent, on trolleybuses, and 28.45 per cent, on trams.
Once again the activities of local authorities call for special comment. Taking into consideration all .classes Df public road transport, the local authorities rank first in respect of the number of rides, their proportion being 43.90 per cent., compared with 30.10 per cent, for the London Passenger Transport Board and 26 per cent, for other operators.
Another interesting point should be noted. For their 43.9 per cent, of passenger journeys, the vehicles of local authorities ran 493,101 miles, whilst for their 26 per cent. of passenger journeys the vehicles of other operators (companies and individuals) had to run 946,033 miles. In passing, it may be observed that there does not appear to be, from the statistics available, any way of accurately determining the proportion of seat-miles remunerative to the operators.
It is, of course, impossible in one short article to deal with all the points of interest that arise from the mass if statistical data now available concerning public service vehicle operation, but reference to the all-important topic of revenue can hardly be omitted. The total traffic revenue for all public service vehicle operation for the year ended December 31, 1937, amounted to £68,003,682, made up if £59,451,650 from stage services, '£2,498,320 from express services, £2.180,424 from excursions and tours, and £3,873,288 from contract work. The total revenue shows an increase of £2,477,209 over 1936.
The local authorities' proportion of the total receipts was £14,276,377, and that of London Transport £15,104,944, whilst the companies, etc., took £38,622,361. These figures, it should be noted, do not include the traffic revenue of trolleybuses, nor, of course, of tramways.
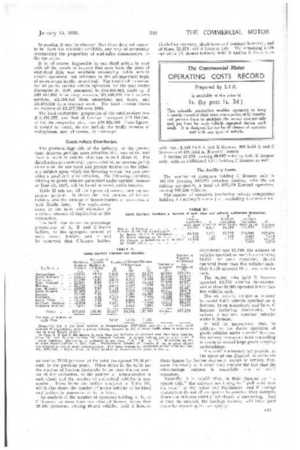
Goods-vehicle Distribution.
The goods-haulage side of the industry, at the present time, deserves perhaps more attention than any other, and there is much of interest that can be said about it. Thu distribution of commercial goods vehicles, as between public carriers on the one hand and private traders on the other, is a subject upon which the licensing system has now provided a good deal of information. The following statistics, relating to goods vehicles authorized under carriers' licences at June 30, 1937, will be found of considerable interest.
Table II sets out all the figures of consequence for our present purpose. It shows the total number of licence. holders, also the number of licence-holders of each class in each Traffic Area. The explanatory notes to the table call attention to
a certain amount of duplication in this Goods Carriers: connection.
The table also shows the percentage proportions of A, B and C-licence holders, to the aggregate number of such licence holders, and it will be observed that C-licence holders
amount to 75.33 per cent. of the total (as against 72.28 per cent. in the previous year). Other items in the table are the number of licences (naturally larger than the net number of licence-holders, or the number of licence-holders in each class) and the number of authorized vehicles in possession. These items are further analysed in Table III, which also shows the number of motor vehicles to be hired and trailers in possession or to be hired.
An analysis of the number of operators holding A, B. or C licences, or more than one class of licence, shows that 25,100 operators, owning 89,492 vehicles, hold A licences short-term) was 23,718, the number of vehicles specified on such licences being 74,011. Of such operators, 20,412 operated fewer than five vehicles each Only 1,128 operated 10 or more vehicles each.
The 34,061 who .held B licences operated 53,775 vehicles thereunder, and of these 32,901 operated fewer than five vehicles each.
The six railway companies referred to owned 9,615 vehicles specified on A licences, 19 on A-contract, and 75 on C
507,256 licences (including short-term). . No railway companies operated vehicles under B licences.
It will be appreciated that, in addition to the direct operation of goods vehicles under carriers' licences, the railway companies hold controlling interests in several large goods-carrying undertakings.
It is neither necessary nor possible, in the space at our disposal, to elaborate these figures by further comment, except to remark, first, upon the clarity with which they disclose the fact that the road-haulage business is essentially one of small operators.
Secondly, it is notable that, in their clamour for " a square deal," the railways are trying to " pull wool over the eyes " of the public and Parliament-and if haulage contractors do not all co-operate to preserve their independence the railways stand a fair chance of succeeding. And if they do succeed, the haulage industry will have good cause for regretting its own apathy.