1936 WHAT NEXT?
Page 38

Page 39

Page 40

If you've noticed an error in this article please click here to report it so we can fix it.
GOODS vehicles up by 12,859. Hackneys advance by 1,196. Does that suggest stagnation? Does it imply that saturation point has been reached? Does it suggest a lack of virility? No, sir, no] Rather does it confirm a tendency which was evident when, a year, ago, we analysed the official returns of new registrations for 1935, and when we boldly asserted that the industry's stability, then apparent, would become stronger and even more deep-rooted in the affairs of the nation. That prophecy has come to pass, in that 14,055 more new vehicles were registered in 1936 than in 1935, which, itself, was nearly 1,000 ahead of the 1934 total.
Progress, "Despite Railway Efforts.
The past year was one of unprecedented activity on the part of the railways in their efforts to cripple road transport, but although their tentacles have spread in many insidious directions, it does seem that, despite their crushing influence, road transport is still able to breathe quite healthily.
But that is not all. The subtle railway plan, now so patently obvious, has awakened a deep sense of misgiving among powerful forces, and there is a growing distrust of railway intentions and a clear-cut recognition of the " raw deal" which has been meted out to road transport.
With defence problems now so much to the fore, this opposition to railway dominance in the transport affairs of the country will go from strength to strength. Let us hope that it possesses the necessary weight to inflict its will upon the powers that be, before it is too late.
Road transport has served the country well in crises in the past, and the future of our race, whatever the perils that beset it, cannot be but obscure if the industry be denied its legi
54
tirnate right to develop along sound economic lines.
For the rest, the legislature will see that it does not get out of hand, so have no fears, you railway shareholders! But temper your optimism with a close analytical study of the graphs and tables of statistics that accompany this article. You rripy then feel disposed to transfer part of your holdings to another branch of the transport industry, for these facts and figures clearly give the lie to any thoughts of the moribund state of road transport, and reveal a condition of prosperity that augurs well for the future.
Here and there minor losses have been incurred, but only then by reason of changing conditions", brought about mainly by legislative barriers. 'Commercial-motor manufacturers will be well repaid by an intensive scrutiny of the graphs and tables, for they offer irrefutable proof of the factors that are influencing the choice of operators and signpost the road upon which future developments may be expected.
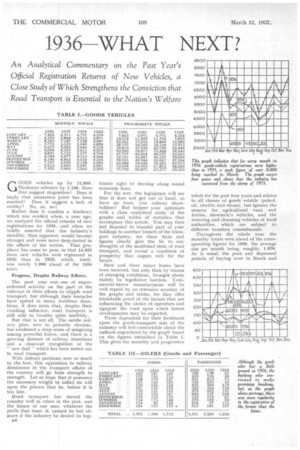
Those dependent for their livelihood upon the goods-transport side of the industry will feel comfortable about the outlook engendered by the graph based on the figures embodied in Table I. This gives the monthly and progressive totals for the past four years and relates to all classes" of goods vehicle (petrol, oil, electric and steam), but ignores the returns for agricultural vans and lorries, showmen's vehicles, and the watering and cleansing vehicles of local authorities, which are subject to different taxation commitments.
Throughout the whole year the monthly totals were ahead of the corresponding figures for 1995, the average rise per month being, roughly, 1,070. As is usual, the peak and depressed periods of buying were in March and
August, respectively. There are known factors to explain this seasonal purchasing disparity, as there are to establish the reasons for the sympathetic rises and falls at stated periods.
Comparing the plottings of the graph shows 'Ready that, despite legislative and other restricting factors, the industry has made a steady and unfaltering recovery from the slump period that caused mild consternation early in 1933.
Dividing the goods-vehicle statistics at a point where the speed factor enters, one finds that 72,140 machines were registered in the five distinct divisions embracing vehicles up to 21 tons unladen weight, which represents a big advance on the previous year's aggregate of 59,483. Above that weight limit there was little to choose between the totals for the two years, the 1936 figure of 5,193 being only 58 up on that for 1935.
In the lightest goods category for petrol vehicles (unlade,n weight not exseeding 12 cwt.), there was only one month-August, which always marks the rockbottom of buying-when the 1,000 mark was not exceeded. The average monthly total was 1,376, contrasted with 1,083 in the previous year.
The 12-cwt.-1-ton petrol division fully recovered from the setback of the previous year, there being more consistency in the month-by-month totals. The aggregate for 1936 was 11,219. against 9,047 for 1935, giving monthly averages of 935 and 754 respectively.
The 1-14-tonners also lost ground in 1935, but here again a recovery was etaged, the earlier year's figure of 6,177 improving to 7,203, the monthly totals ranging from 452 in August to 773 in December.
When one remembers the present-day tendency it is not surprising to note the continued fall in the registration of 14-2-tonners, although the 1936 total of 13,536, being only 100 down on the 1935 figure, effectively checked the bad tumble of over 3,000 which was registered in the latter year, contrasted with 1934.
The largest category enjoying the maximum speed concession (2-21tonners) quite naturally shows a further improvement, and in five separate months over 2,000 vehicles were registered. The year's total of 23,668 was 6,056 up on the 1935 figure, which, in itself, was higher by over 2,000 than that for 1934. The monthly averages for 2-21-tonners in the two years were 1,972 in 1936 and 1,467 in 1935.
We have already commented on the fact that vehicles above the 21-ton unladen weight limit appear to attract relatively few buyers, and it is difficult to envisage a return to popularity of such types until some relief is forthcoming in taxation, or some concession in the legal speed limit is granted. Is that likely? No, sir, no!
It is a little perplexing to understand why the goods oiler is at a standstillit is hardly that, because in 1936 it lost ground_ to the extent of 42 registrations, whilst last year's figure of 1,552 is well short of the 1934 total. The fact that the oiler shows to greatest economical advantage on heavy-duty trunk haulage, vehicles for which . have, as already indicated, shown a decline, is not the answer, because oilers of not over 24 tons unladen weight fell from 195 in 1935 to 128 in 1936.
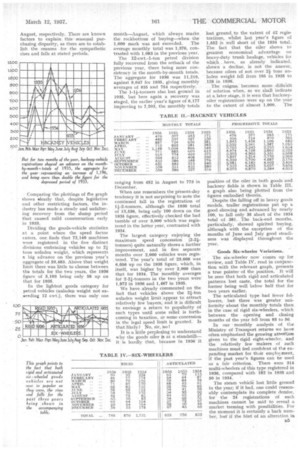
The enigma becomes more diffieult of solution when, as we. shall indicate at a, later stage, it is seen that hackneyoiler registrations Were up on the year to the extent of almost 1,000. The position of the oiler in both goods and hackney fields is shown in Table III. a graph also being plotted from the figures embodied therein.
Despite the falling off in heavy goods models, trailer registrations put up a good showing and advanced by nearly 100, to fall only 35 short of the 1934 total of 381. The back-end months, particularly, showed spirited buying, although with the exception of the months of June and July good steadiness was displayed throughout the year.
Goods Six-wheeler Variations.
The six-wheeler now comes up for review, and Table IV, read in conjunction with the relevant graph, presents a true pointer of the position. It will be seen that both rigid and articulated patterns lost caste, the total for the former being well below half that for two years earlier.
The articulated type had fewer followers, but there was greater uniformity about the monthly totals than in the case of rigid six-wheelers, which between the opening and closing months of the year fell from 93 to 56.
In our monthly analysis of the Ministry of Transport returns we have often emphasized the growing attention given to the rigid eight-wheeler, and the relatively few makers of such machines must feel confident of the expanding market for ththr emplolment, if the past year's figures can be used as a fair criterion. There were 314 multi-wheelers of this type registered in 1936, compared with 182 in 1935 and 50 in 1934.
The steam vehiel lost little ground in the year; if it had, one could reasonably contemplate its complete demise, for the 24 registrations of such machines cannot be said to reveal a market teeming with possibilities. For the moment it is certainly a back number, but' if the hint of an alteration in the law affecting this class of vehicle should materialize and certain concessions be granted it in respect of taxation, or weight limits, then it may once again attract the attention of certain classes of operator and figure more prominently in the registration returns.
We know that certain interesting manufacturing developments are on the tapis, and, perhaps, if they ultimately have a satisfactory outcome, the prestige of the steamer may, to some extent, be restored.
The electric Sparkles.
The position of the electric reveals a healthy state of affairs, and its pro
gress continues unabated. The 819 registrations for last year, contrasted with 632 in 1935 and 369 in 1934, and whilst the greatest proportion are in the two categories up to one ton (there were 339 not exceeding 12 cwt.), it is informative to note that, of late months, there have been a few vehicles licensed in the heavier classes. A close study of this particular phase suggests that only the fringe of development has, as yet, been touched.
Testimony of the agriculturist's increasing reliance upon the motor vehicle for a wide variety of farming tasks is evident from the registration figures, which show an appreciation in the 1935 total of 924 to 1,112 a year later. The vehicles used by agriculturists are listed independently in the official returns, which show that practically all of them, as in the past, were petrol-engined.
After two good years the tractor fell from grace somewhat in 1936, when 304 such machines were registered, the figures for the two previous years being 434 and 461. See Table V. In the returns, tractors are split up into three
distinct sections—agricultural, general haulage and showmen's, last year's registrations in them being 85, 216 and 3 in that order.
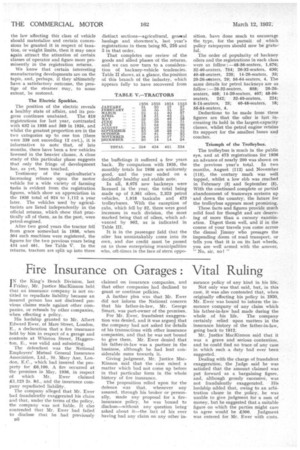
That completes our review of the goods and allied phases of the returns, and we can now turn to a consideration of hackney-vehicle tendencies. Table II shows, at a glance, the position of this branch of the industry, which appears fully to have recovered from
the buffetings it suffered a few years back. By comparison with 1935, the monthly totals for 1936 are uniformly good, and the year ended on a decidedly healthy and stable note.
In all, 8,075 new hackneys were licensed in the year, the total being made up of 3,361 oilers, 2,323 petrol vehicles, 1,918 taxicabs and 473 trolleybuses. With the exception of cabs, which fell by 52, there were good increases in each division, the most marked being that of oilers, which advanced by 962, as is indicated in Table III.
It is in the passenger field that the oiler has unmistakably come into its own, and due credit must be passed on to those enterprising municipalities who, oft-times in the face of stern oppo
sition, have done much to encourage the type, for the pursuit of which policy ratepayers should now be grateful.
The order of popularity of hackney oilers and the registrations in each class were as follow :-48-56-seaters, 1,676; 32-40-seaters, 754; 26-32-seaters, 630; 40-48-seaters, 235; 14-20-seaters, 33; 20-26-seaters, 29; 56-64-seaters, 4. The same details for petrol hackneys are as
follow : —26-32-seaters, 858; 20-26seaters, 468; 14-20-seaters, 407; 48-66seaters, 242; 32-40-seaters, 224; 8-14-seaters, 25; 40-48-seaters, 18; 56-64-seaters, 4.
Deductions to be made from these figures are that the oiler is fast increasing its hold in the largest-capacity classes, whilst the petrol engine retains its support for the smallest buses and coaches.
Triumph of the Trolleybus.
The trolleybus is much in the public eye, and at 473 registrations for 1936 an advance of nearly 200 was shown on the previous year's total. In two months, August (112) and November (115), the century mark was well topped, whilst a low ebb was reached in February (3) and September (5). With the continued complete or partial abandonment of tramways systems up and down the country, the future for the trolleybus appears most promising.
These facts and figures provide much solid food for thought and are deserving of more than a cursory examination. Digest them well, and if in the course of your travels you come across the dismal Jimmy who presages the impending doom of road transport, or tells you that it is on its last wheels, you are well armed with the answer, "No, sir, not"


