17. Profit measurement and the monthly trading report
Page 32

Page 33

If you've noticed an error in this article please click here to report it so we can fix it.
ALTHOUGH I have taken the own-account operator's cost analyst almost to the end of the Flow-line System, he can still learn something from this exposé of the haulier's potential profit and the yardsticks employed to ascertain if an investment in road transport is worth the effort and risk involved.
As from March next year, all present holders of A, B or C carriers' licences for vehicles up to 16 tons g.v.w. will eventually become holders of operators' licences and this will enable the holder to use his vehicles both in connection with his own business and for hire or reward, without restriction. For this reason alone I hope to retain the interest of the own-account operator so that he may become more enlightened, or disillusioned as the case may be, on the merit of exploiting his new freedom.
I think I can safely say that we have explored costing as such to the full although we have not as yet finished with all its uses. At this point we have progressed from the unit of cost, i.e. the vehicle, through to fleet costing, and now to Management Accounting via an appreciation of budgetary control. Shortly, we shall examine what is almost the end-product of all that has gone before, in the form of the monthly trading and financial account, in which our budgets and profit forecasts will be prominent.
Before we can proceed thus far, however, it is necessary to appreciate on what basis we can regard profit as being good, bad or indifferent. So far, management have agreed that a fair return would be 20 per cent on the budgeted turnover of £3,000 per 20-day month, thus projecting a monthly profit of £600. Invariably the ratio of profit to turnover is used as a yardstick for the simple reason that it is a relatively easy figure to calculate as indeed we have already done. However, in a business where there is a large element of capital invested, such as in buildings, and in our case vehicles, it is necessary to question if the return—often referred to as the yield—is commensurate with the investment risk. For example, in these times of high interest rates one can obtain a fixed interest rate of 10 per cent on loans to local corporations and certain other reliable institutions, and apart from the debasement of the capital and interest due to inflation, there is no other risk.
The own-account operator's investment in his transport adds nothing to the value of his product and although the transport department may have to bear an interest rate equal to the return the company could obtain by investing the money elsewhere, or equal to the yield they themselves expect, this is internal book-keeping. The investment in its transport is regarded as the preservation of the goodwill of its customers, because the service they give is completely within their own control. On the other hand, the haulier invests in vehicles, and the facilities to maintain them, in pursuit of profit and, as the main theme of this series intends, he will endeavour to secure the maximum profit. The question is: What is "the maximum" in the form of the return on his investment?
In my view this should be 20 per cent for the following reasons: 1. A commercial vehicle is a rapidly wasting asset, consequently the capital is always at risk.
2. The industry has been subject to political intervention for almost 40 years.
3. The industry is both highly capital and labour intensified—meaning that, unlike fixed plant or stationary machines, a vehicle still requires at least one driver to operate it.
4. The dearth of really skilled drivers contributes to a high rate of depreciation.
5. It is an undisciplined industry in which , rates are frequently based on what the traffic will bear, as opposed to the return required to maintain the vehicles to a high standard, and provide good customer service at an economical cost.
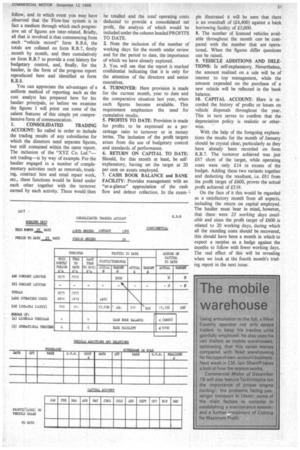
Having set a target of 20 per cent on capital employed we have to calculate the amount invested, so I shall use our familiar six-vehicle/trailer operator to illustrate the build-up of his asset values and in which his capital is put to work. For the purpose of this exercise we will assume that the assets employed are those applicable to the commencement of his financial year. Indeed, if you refer to the vehicle depreciation and capital account (CM October 10), you will see that the written-down value of his fleet at the end of the last financial year is repeated in the following assets schedule:—
This is a simple presentation of how the haulier's capital is deployed and, as you can appreciate, with the exception of buildings and land, the other assets are prone to fluctuate in value from month to month, consequently the true value can only be determined according to cost or market value, whichever is the lower, at the time they are being reviewed—hence the notation against the asterisk.
It is fortuitous that we start with a total asset value of £36,000 as in taking onetwelfth of this in order to calculate the haulier's first month's yield on "assets employed" provides us with the same figure, i.e. £3,000, as our monthly turnover target. For this first month, therefore, there will be some affinity between the turnover objective and the assets employed figure. This will not always be the case since as I have stated assets employed are "a living thing" and as such prone to change. There is another aspect to consider concerning ploughedback profits with which we shall have to deal when it can be ascertained what is involved. A final point on quantifying asset values is the need to distinguish between their value as a going concern as opposed to break-up value in a liquidation.
Throughout the whole of this series I have employed the same figures of vehicle performance, revenue and cost as recorded on Form R.B.7 and elsewhere, in order to preserve continuity such as one would in a case study. If you have followed the series throughout you will recognize some of these figures in the monthly trading reports tc
follow, and in which event you may have observed that the Flow-line system is in fact a medium through which each progressive set of figures are inter-related. Briefly, all that is involved is that commencing from each "vehicle record" form R.B.6, the totals are collated on form R.B.7, firstly month by month, and then cumulatively on form R.B.7 to provide a cost history for budgetary control, and, finally, for the haulier, in the form of the progress report reproduced here and identified as form R.B.8.
You can appreciate the advantages of a uniform method of reporting such as the cost analyst has prepared here for his haulier principals, so before we examine the figures I will point out some of the salient features of this simple yet comprehensive form of communication.
1. CONSOLIDATED TRADING ACCOUNT: So called in order to include the trading results of any subsidiaries for which the directors need separate figures, but still contained within the same report. The inclusion of the "XYZ Co. Ltd."— nit trading—is by way of example. For the haulier engaged in a number of complementary activities such as removals, trunking, contract hire and retail repair work, etc., these functions would be listed under each other together with the turnover earned by each activity. These would then
be totalled and the total operating costs deducted to provide a consolidated net profit, the analysis of which would be included under the column headed PROFITS TO DATE.
2. Note the inclusion of the number of working days for the month under review and for the period to date, the importance of which we have already explored.
3. You will see that the report is marked confidential indicating that it is only for the attention of the directors and senior executives.
4. TURNOVER: Here provision is made for the current month, year to date and the comparative situation last year, when such figures become available. This requirement emphasizes the need for cumulative results.
5. PROFITS TO DATE: Provision is made for profits to be expressed as a percentage ratio to turnover or in money terms. The inclusion of the profit targets arises from the use of budgetary control and standards of performance.
6. RETURN ON CAPITAL TO DATE: Should, for this month at least, be selfexplanatory, having set the target at 20 per cent on assets employed.
7. CASH BOOK BALANCE and BANK FACILITY: Provides management with an "at-a-glance" appreciation of the cash flow and debtor collection. In the exam
ple illustrated it will be seen that there is an overdraft of (£4,400) against a bank borrowing facility of £5,000.
8. The number of licensed vehicles available throughout the month can be compared with the number that are operational. When the figures differ questions can be raised.
9. VEHICLE ADDITIONS AND DELETIONS: Is self-explanatory. Nevertheless, the amount realized on a sale will be of interest to top management, while the amount expended on the purchase of a new vehicle will be reflected in the bank balance.
10. CAPITAL ACCOUNT: Here is recorded the history of profits or losses on vehicle disposals throughout the year. This in turn serves to confirm that the depreciation policy is realistic or otherwise.
With the help of the foregoing explanations the results for the month of January should be crystal clear, particularly as they have already been recorded on form R.B.7. The turnover achieved was just £67 short of the target, while operating costs were only £14 in excess of the budget. Adding these two variants together and deducting the resultant, i.e. £81 from the profit target of £600, proves the actual profit achieved of £519.
On the face of it this would be regarded as a satisfactory month from all aspects, including the return on capital employed. The haulier must bear in mind, however, that there were 23 working days available and since the profit target of £600 is related to 20 working days, during which all the standing costs should be recovered, this should have been a month in which to expect a surplus as a hedge against the months to follow with fewer working days. The real effect of this will be revealing when we look at the fourth month's trading report in the next issue.


