 1
1 2
2 3
3 4
4 5
5 6
6 7
7 8
8 9
9 10
10 11
11 12
12 13
13 14
14 15
15 16
16 17
17 18
18 19
19 20
20 21
21 22
22 23
23 24
24 25
25 26
26 27
27 28
28 29
29 30
30 31
31 32
32 33
33 34
34 35
35 36
36 37
37 38
38 39
39 40
40 41
41 42
42 43
43 44
44 45
45 46
46 47
47 48
48 49
49 50
50 51
51 52
52 53
53 54
54 55
55 56
56 57
57 58
58 59
59 60
60 61
61 62
62 63
63 64
64 65
65 66
66 67
67 68
68 69
69 70
70 71
71 72
72 73
73 74
74 75
75 76
76 77
77 78
78 79
79 80
80 81
81 82
82 83
83 84
84 85
85 86
86 87
87 88
88 89
89 90
90 91
91 92
92 93
93 94
94 95
95 96
96 97
97 98
98 99
99 100
100 101
101 102
102 103
103 104
104 105
105 106
106 107
107 108
108 109
109 110
110 111
111 112
112 113
113 114
114 115
115 116
116 117
117 118
118 119
119 120
120 121
121 122
122 123
123 124
124 125
125 126
126 127
127 128
128 129
129 130
130 131
131 132
132 133
133 134
134 135
135 136
136 137
137 138
138 139
139 140
140 141
141 142
142 143
143 144
144 145
145 146
146 147
147 148
148 149
149 150
150 151
151 152
152 153
153 154
154 155
155 156
156 157
157 158
158 159
159 160
160 161
161 162
162 163
163 164
164 165
165 166
166 167
167 168
168 169
169 170
170 171
171 172
172 The numbers game
Page 24
Page 25
If you've noticed an error in this article please click here to report it so we can fix it.
The DfT's latest road freight statistics provide a valuable insight into the ins and outs of the haulage industry, but treat the findings with caution.
Words; David Harris
FOR THE UK ROAD haulage industry, the road freight statistics from the Department for Transport (DfT) are rather like a candid family portrait. The latest figures, which came out at the end of August, show who makes up the industry, how their business is going and can even give hints about what might happen in the future.
But like all statistics, they need careful handling. It is easy to draw simplistic conclusions. So, for example, while total freight moved between 1997 and 2007 was up 8%, the more relevant figure is that this compares with a gross domestic product (GDP) increase over the same period of 32%.
In other words, freight did increase, but not as much as general economic growth overall.
Between 2006 and 2007, the increase was better than at any time since the mid-1990s. Goods moved in 2007 increased by 4% to 161 billion tonne-kilometres. Inconsistency in growth has been a feature of haulage for many years. There was a sharp increase in growth between 1986 and 1989, when tonne kilometres rose by 31%, a sharp decline between then and 1993, and while there has been consistent growth since, sonic of it has been at a snail's pace.
Over the same period, there has been a change in the type of vehicles hauliers favour. In 1980, rigids accounted for 66% of all goods carried, but by 2007 this had fallen to 46%. Between 1980 and 2007, the weight of goods carried by rigids remained constant, but the ton nage on artics increased by a massive 123%. Bigger trucks are carrying more of the load in more senses than one.
The latest figures show there were 446,000 goods vehicles above 3.5 tonnes registered in Britain, of which 9% were first registered in 2007. This means that in 2007 there were 41,000 new vehicles above 3.5 tonnes registered, 8,000 fewer than in 2006 and the lowest number of new reg istrations since 1997. The total number of vehicles registered has risen by 8% since 1997.
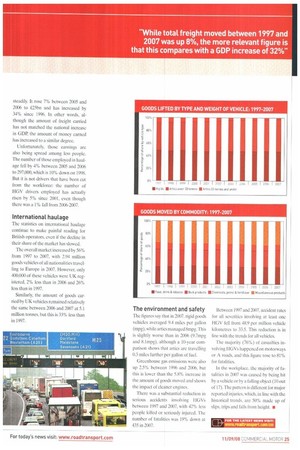
The figures confirm the trend for fewer operators to run more trucks. The number of goods vehicle 0-licences in circulation has dropped from 115,000 in 1997 to 100,000 in 2007. But yet again, the statistics contain subtleties. Trends rarely move in straight lines. So while the average size of operators' fleets increased steadily from 1997 to 2004, from 3.5 to 4 vehicles, by 2007 it had fallen back to an average of 3.7 vehicles.
Traditional characteristics
Even with these changes, many of the old characteristics of the traditional British road haulage industry remain. The latest figures indicate that 45% of operators (44,700) are still one-vehicle bands, while fleets of more than 100 vehicles make up just 0.3% of the total British haulage businesses — although they do now account for 14% of the total number of vehicles.
Importantly, the amount of cash earned by British hauliers is going up steadily. It rose 7% between 2005 and 2006 to £25bn and has increased by 34% since 1996. In other words, although the amount of freight carried has not matched the national increase in GDP, the amount of money earned has increased to a similar degree.
Unfortunately, those earnings are also being spread among less people. The number of those employed in haulage fell by 4% between 2005 and 2006 to 297,000, which is 10% down on 1998. But it is not drivers that have been cut from the workforce: the number of HGV drivers employed has actually risen by 5% since 2001, even though there was a 1% fall from 2006-2007.
International haulage
The statistics on international haulage continue to make painful reading for British operators, even if the decline in their share of the market has slowed.
The overall market increased by 56% from 1997 to 2007, with 2.94 million goods vehicles of all nationalities travelling to Europe in 2007. However, only 400,000 of these vehicles were UK registered, 2% less than in 2006 and 26% less than in 1997.
Similarly, the amount of goods carried by UK vehicles remained relatively the same between 2006 and 2007 at 5.1 million tonnes, but this is 33% less than in 1997.
The environment and safety
The figures say that in 2(X)7. rigid goods vehicles averaged 9.4 miles per gallon (mpg), while artics managed 8mpg. This is slightly worse than in 2006 (9.7mpg and 8.1mpg), although a 10-year comparison shows that artics are travelling 0.3 miles further per gallon of fuel.
Greenhouse gas emissions were also up 2.5% between 1996 and 2006, but this is lower than the 5.8% increase in the amount of goods moved and shows the impact of cleaner engines.
There was a substantial reduction in serious accidents involving HGVs between 1997 and 2007. with 42% less people killed or seriously injured. The number of fatalities was 19% down at 435 in 2007. Between 1997 and 2007, accident rates for all severities involving at least one HGV fell from 48.9 per million vehicle kilometres to 33.5. This reduction is in line with the trends for all vehicles.
The majority (76%) of casualties involving HGVs happened on motorways or A roads, and this figure rose to 81% for fatalities.
In the workplace, the majority of fatalities in 2007 was caused by being hit by a vehicle or by a falling object (10 out of 17). The pattern is different for major reported injuries, which, in line with the historical trends, are 50% made up of slips, trips and falls from height. •
FR,
FO FI THE LATEST HEWS VISIT:
mivw.roadtransport com!cm