Help us to push for 50
Page 24

If you've noticed an error in this article please click here to report it so we can fix it.
In case you needed convincing, here are more facts in support of our Pushing 50 campaign — help us campaign for common sense!
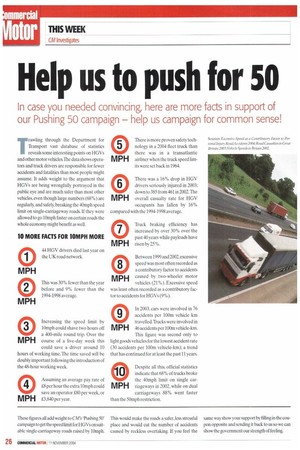
Trawling through the Department for Transport vast database of statistics reveals some interesting points on HGVs and other motor vehicles.The data shows operatots and truck drivers are responsible for fewer accidents and fatalities than most people might assume. It adds weight to the argument that HGVs are being wrongfully portrayed in the public eye and are much safer than most other vehicles, even though large numbers (68%) are regularly, and safely, breaking the 40mph speed limit on single-carriageway roads. If they were allowed to go lOmph faster on certain roads the whole economy might benefit as well.
10 MORE FACTS FOR 10MPH MORE
44 HGV drivers died last year on the UK road network.
This was 30% fewer than the year before and 9% fewer than the MPH 1994-1998 average.
Increasing the speed limit by lOmph could shave two hours off a 400-mile round trip. Over the course of a five-day week this could save a driver around 10 hours of working time. The time saved will be doubly important following the introduction of the 48-hour working week.
Assuming an average pay rate of £8 per hour the extra lOmph could save an operator £80 per week, or £3.840 per year. There is more proven safety technology in a 2004 fleet truck than there was in a transatlantic airliner when the truck speed limits were set back in 1964.
MPH
There was a 16% drop in HGV drivers seriously injured in 2003: down to 385 from 461 in 2002. The overall casualty rate for HGV occupants has fallen by 16% compared with the 1994-1998 average.
Truck braking efficiency has increased by over 30% over the past 40 years while payloads have risen by 25%.
Between 1999 and 2002, excessive speed was most often recorded as a contributory factor to accidents caused by two-wheeler motor vehicles (21%). Excessive speed was least often recorded as a contributory factor to accidents for HGVs (9%).
MPH
In 2003, ears were involved in 76 accidents per 100m vehicle km travelled.Tnicks were involved in 46 accidents per 100m vehicle-km. This figure was second only to light goods vehicles for the lowest accident rate (30 accidents per 100m vehicle-km); a trend that has continued for at least the past 11 years.
MPH
Despite all this, official statistics indicate that 68% of trucks broke the 40mph limit on single carriageways in 2002, while on dual carriageways 88% went faster than the 50mph restriction.
MPH


