All-round Increase of Traffic in Europe
Page 34

If you've noticed an error in this article please click here to report it so we can fix it.
THE second annual bulletin of trans' port statistics published on Wednesday by the United Nations Economic Commission for Europe,reveals that since 1949 there has been a general increase in traffic by all forms of transport in most European countries. The rate of increase was most marked at the end of the year. The transport position in 17 countries is dealt with in the
bulletin.
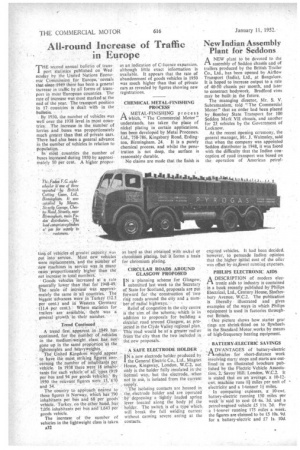
By 1950, the number of vehicles was well over the 1938 level in most countries. The increase in the number of lorries and .buses was proportionately much greater than that of-private cars. There had also been a general advance in the number of vehicles in relation to population. In Molt :countries the number of buses increased during 1950 by approxi irately 10 per cent. A higher propor.
(ion of vehicles of greater capacity was put into service. Most new vehicles were replacements, and the number of new machines in service was in many cases proportionately higher than the net increase in total numbers.
Goods vehicles increased at a rate generally lower than that for 1948-49. The scale of increase was approximately the same in all countries. The biggest advances were in Turkey (12.5 per cent.) and in Western Germany, • (11.4 per cent.). Where statistics for trailers are available, there was a general growth in their number.
Trend Continued
A trend first apparent in -1949, has continued, for the number of ,vehicles in the medium-weight class has not-' gone up in the same' propOrtion'ai the lightweights and heavyweights. The United Kingdom would appear to have the most striking figure's concerning the number of inhabitants per vehicle. In 1938. there .weie 18 inhähilants for each vehicleof all types (919 Per bus and 94 per goods (vehicle).By 1950 the relevant figures were 15;670
,
The country to approach nearest to these figures is Norway, which has 190 inhabitants per bus and 68 per goods' vehicle. Turkey. on the other hand, has 7,056 inhabitants per bus and 1,643 per goods vehicle. The increase of the number of vehicles in the liglitweight class is taken it32
as an indication of C-licence expansion, although little exact information is available. It appears that the rate of abandonment of goods vehicles in 1950 was much higher than that of private cars as revealed by figures showing new registrations.


