


GOODS -VEHICLE ROAD ST RESULTS ANALYSED D URING the past 12
Page 42
Page 43
Page 44
Page 45
If you've noticed an error in this article please click here to report it so we can fix it.
months we have subjected to our standardized road test a wide and representative variety of commercial vehicles. Models of nearly all the commonly used types have passed through our hands. Accordingly, the results constitute what is probably an unique record, and should afford a valuable standard from which to judge the behaviour of vehicles, or to employ as data in designing new models.
On these pages appear graphic representations of the results of classifying and averaging a number of important returns extracted from the reports of road tests of goods vehicles that we have carried out.
Although nearly complete the range tested in the past year is not entirely so. We have, therefore, included in the charts, in a few cases, representative returns extracted from reports of vehicles tried-out prior to August, 1933, for example, the 1-tonner and the oil-engined 12-tonner.
Referring still to the charts, we wish to point out that in studying the figures it must be remembered that, hi some cases, both better and worse perform ances than those given have been obtained from certain of the machines tested, whilst in others only one example of the class has been available, also that there may have been something exceptional about it or about the circumstances of the test.
For instance, braking tests may have been carried out on wet roads, the powerto-weight ratio may have been different from the average, a number of stops may have been made—as
is our general practice with small delivery vans—during the consumption test, and so forth. An indication, however, of the all-round efficiency of the particular type in question is afforded in almost every case if all the figures applying to it be studied in conjunction with one another. Where a machine gains in one respect it may lose in another.
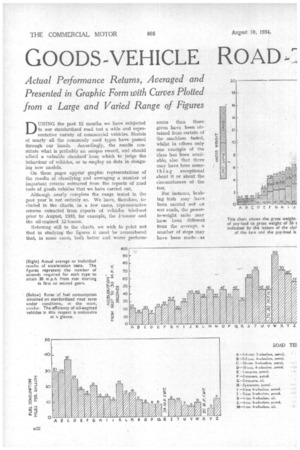
Considering n o w the four curves of fuel consumption, acceleration, braking
and power-to-weight ratio, which are reproduced in graph form, these have been drawn out from a wealth of figures which have differed widely—as can be seen even from the charts, where the averages have already been calculated.
In spite, however, of the variations in the performance of the models in almost every type, the course of a smooth curve, in each case, has appeared unmistakably, therefore, the set of graphs serves a purpose of practical use, as well as-being of academic interest.
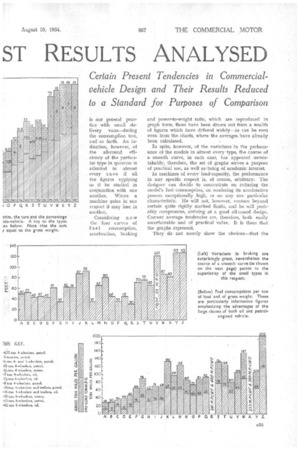
In machines of every load-capacity, the performance in any specific respect is, of course, arbitrary. The designer can decide to concentrate on reducing the model's fuel consumption, on rendering its accelerative powers exceptionally high, or on any one particular characteristic. He will not, however, venture beyond certain quite rigidly marked limits, and he will probably compromise, arriving at a good all-round design. Current average tendencies are, therefore, both casily ascertainable and of practical value. It is these that the graphs represent.
They do not merely show the obvious—that the
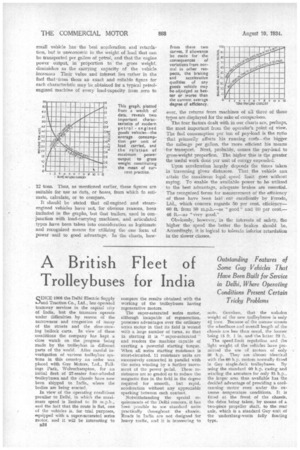
small vehicle has the best acceleration and 'retardation, buf is uneconomic in the weight of load that can be transported per gallon of petrol, and that the engine power output, in proportion to the gross weight, diminishes as the carrying capacity of the vehicle increases Their value and interest lies rather in the fact that 'from them an exact and reliable figure for each characteristic may be obtained for a typical petrolengined machine of every load-capacity from zero to This graph, plotted from a wealth of
data, reveals two important characteristics of modern petrol engined goods vehicles—the
average consumption per unit of load carried, and the relation of maximum power Output to gross weight constituting the mean of cur rent practice.
12 tons, Thus, as mentioned earlier, these figures are suitable for use as data, or bases, from which to estimate, calculate, or to compare.
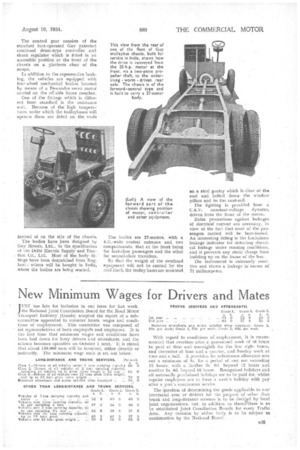
It should be stated that oil-engined and steamengined vehicles have not, for obvious reasons, been included in the graphs, but that trailers, used in conjunction with load-carrying machines, and articulated types have been taken into consideration as legitimate and recognized means for utilizing the one form of power unit to good advantage. In the charts, how
ever, the returns from machines of all three of these types are displayed for the sake of comparison.
The fatir factors dealt with in our charts are, perhaps, the most important from the operator's point of view. The fuel consumption per ton of pay-load is the ratio that primarily affects his running costs—the bigger the mileage per gallon, the more efficient his means • for transport. Next, probably, comes the pay-load to gross-weight proportion. The higher this is the greater. the useful work done per unit of energy expended. Upon acceleration largely depends the times taken in traversing given distances. That the vehicle can attain the maximum legal speed limit goes without saying. To enable the available power to be utilized to the best advantage, adequate brakes are essential. The recognized terms for measurement of the efficiency
ofhave been laid out excellently by Feroclo, Ltd., which concern regards 50 per cent, efficiency60 ft. from 30 m.p.h.—as " good " and 00 per cent.46 ft.—as "very good,"
Obviously, however, in the interests of safety, the higher the speed the better the brakes should be. Accordingly, it is logical to tolerate inferior retardation in the slower classes.
The control gear consists of the standard foot-operated Guy patented combined drum-type controller and shunt regulator which is fitted in an accessible position at the front of the chassis on a platform clear of the motor.
In addition to the regenerative braking, the vehicles are equipped with four-wheel mechanical brakes boosted by means of a Dewandre servo motor carried on the off-side frame member.
One of the fittings which is different from standard is the resistance unit. Because of the high temperatures under which the trolleybuses will operate these are fitted on the roofs
instead of on the side of the chassis.
The bodies have peen designed by Guy Motors, Ltd., to the specification of the Delhi Electric Supply and Traction Co., Ltd. Most of the body fittings have been despatched from England; others will be bought in India, where the bodies are being erected.
The bodies are t 7-seaters, with a 4-ft.-wide central entrance and two compartments, that at the front being for first-class passengers and the other for second-class travellers.
So that the weight of the overhead equipment will not be carried by the roof itself, the trolley bases are mounted on a steel gantry which is clear of the roof and bolted down the window pillars and to the cant-rail.
The lighting is provided from a C.A.V. constant-voltage dynamo. driven from the front of the motor.
Extra precautions against leakages of electrical current are necessary, in view of the fact that most of the passengers carried will be bare-footed. An interesting fitting is the Leakalarrn leakage indicator for detecting electrical leakage under running conditions, . and it prevents any static charge from building up on the frame of the bus.
The instrument is extremely sensitive and shows a leakage in excess of 2 milliamperes.