 1
1 2
2 3
3 4
4 5
5 6
6 7
7 8
8 9
9 10
10 11
11 12
12 13
13 14
14 15
15 16
16 17
17 18
18 19
19 20
20 21
21 22
22 23
23 24
24 25
25 26
26 27
27 28
28 29
29 30
30 31
31 32
32 33
33 34
34 35
35 36
36 37
37 38
38 39
39 40
40 41
41 42
42 43
43 44
44 45
45 46
46 47
47 48
48 49
49 50
50 51
51 52
52 53
53 54
54 55
55 56
56 57
57 58
58 59
59 60
60 61
61 62
62 63
63 64
64 65
65 66
66 67
67 68
68 69
69 70
70 71
71 72
72 73
73 74
74 75
75 76
76 77
77 78
78 79
79 80
80 81
81 82
82 83
83 84
84 85
85 86
86 87
87 88
88 89
89 90
90 91
91 92
92 93
93 94
94 95
95 96
96 97
97 98
98 99
99 100
100 101
101 102
102 103
103 104
104 105
105 106
106 107
107 108
108 109
109 110
110 111
111 112
112 113
113 114
114 115
115 116
116 117
117 118
118 119
119 120
120 121
121 122
122 123
123 124
124 125
125 126
126 127
127 128
128 129
129 130
130 131
131 132
132 133
133 134
134 135
135 136
136 137
137 138
138 139
139 140
140 141
141 142
142 143
143 144
144 145
145 146
146 147
147 148
148 149
149 150
150 151
151 152
152 153
153 154
154 155
155 156
156 157
157 158
158 159
159 160
160 161
161 162
162 163
163 164
164 What is the Future of the Passenger-transport Industry?
Page 82
Page 83
If you've noticed an error in this article please click here to report it so we can fix it.
BY way of preface to our statistical review of " progress " in the passenger-transport industry during 1933, may we fervently express the hope that the Minister of Transport will. leave us alone for a while? The knits of "co-ordination," " rationalization " and the rest are obtainable, it would appear, only by a sacrifice of the common food by which we live.
• The effects of the Road Traffic Act, 1930, railway and political agitation, the Salter Report, and threats of further legislative action to curb the enterprise of road transport are clearly seen in the census figures for the year ended September 30 last.
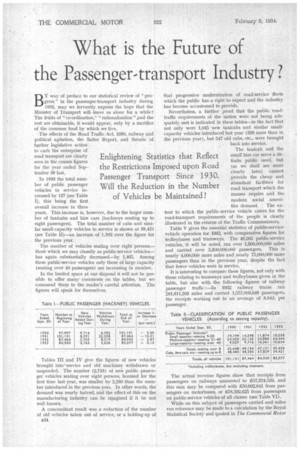
In 1933 the total number of public passenger
vehicles in service increased by 127 (see Table I), this being the first overall increase in three years. This increase is, however, due to the larger number of taxicabs and hire cars (hackneys seating up to eight passengers). The total number of cabs and similar small-capacity vehicles in service is shown at 39,421 (see Table II)-an increase of 1,592 over the figure for
the previous year. , The number of vehicles seating over eight personsthose which we may classify as public-service vehicleshas again substantially decreased-by 1,465. Among these public-service vehicles only those of large capacity (seating over 40 passengers) are increasing in number.
In the limited space at our disposal it will not be possible to offer many comments on the tables, but we commend them to the reader's careful attention. The figures will speak for themselves.
Tables III and IV give the. figures of new vehicles brought into`service and old machines withdrawn or suspended. The number (2,718) of new public passenger vehicles seating over eight persons, licensed for the first time last year, was smaller by 2,280 than the number introduced in the previous year. In other words, the demand was nearly halved, and the effect of this on the manufacturing industry can be imagined if it be not well known.
A concomitant result was a reduction of the number of old vehicles taken out of service, or a holding-up of that progressive modernization of road-service fleets which the public has a right to expect and the industry has become accustomed to provide.
Nevertheless, a further proof that the public roadtraffic requirements of the nation were not being adequately met is indicated in these tables-in the fact that not only were 1,045 new taxicabs and similar smallcapacity vehicles introduced last year (338 more than in the previous year), but 547 old cabs. etc., were brought back into service.
The taxicab and the small hire car serve a definite public need, but (as we shall see more clearly later) cannot provide the cheap and abundant facilities for road transport which the masses require and the modern social amenities demand. The extent to which the public-service vehicle caters for the road-transport requirements of the people is clearly illustrated in the returns of the Traffic Commissioners.
Table V gives the essential statistics of public-servicevehicle operation for 1932, with comparative figures for trolleybuses and tramways. The 46,265 public-service vehicles, it will be noted, ran over 1,300,000,000 miles and carried over 5,300,000,000 passengers. This is nearly 4,000,000 more miles and nearly 75,000,000 more passengers than in the previous year, despite the fact that fewer vehicles were in service.
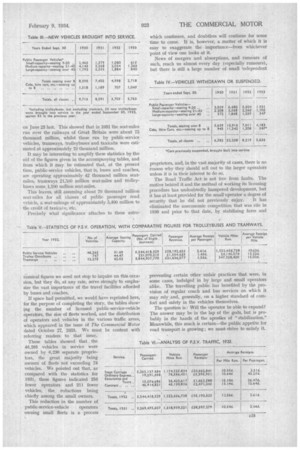
It is interesting to compare these figures, not only with those relating to tramways and trolleybuses given in the table, but also with the following figures of railway passenger traffic :-In 1932 railway trains ran 281,611,203 miles and carried 1,557,003,648 passengers, the receipts working out to an average of 8.84d. per passenger.
The actual revenue figures show that receipts from passengers on railways amounted to £57,324,529, and this sum may be compared with £50,662,841 from passengers on motorbuses, or £58,192,625 from passengers on public-service vehicles of all classes (see Table VI).
While on this subject of passengers carried and miles run reference may be made to a calculation by the Royal Statistical Society and quoted in The Commercial Motor on June 23 last. This showed that in 1931 the seat-miles run over the railways of Great Britain were about 75 thousand million, whilst those run by public-service vehicles, tramways, trolleybuses and taxicabs were estimated at approximately 70 thousand million.
It may be interesting to amplify these statistics by the aid of the figures given in the accompanying tables, and from which it may be estimated that, at the present time, public-service vehicles, that is, buses and coaches, are operating approximately 42 thousand million seatmilesi tramways 21,500 million seat-miles and trolleybuses some 1,100 million seat-miles.
This leaves, still assuming about 70 thousand million seat-miles for all classes of public passenger road vehicle, a seat-mileage of approximately 3,400 million to the credit of taxical).:, etc.
Precisely what significance attaches to these astro
nomical figures we need not stop to inquire on this occasion, but they do, at any rate, serve strongly to emphasize the vast importance of the travel facilities afforded by buses and coaches.
If space had permitted, we would have reprinted here, for the purpose of completing the story, the tables showing the number of licensed public-service-vehicle operators, the size of fleets worked, and the distribution of operators and vehicles in the various traffic areas, which appeared in the issue of The Commercial Motor dated October 27, 1933. We must be content with referring readers to that issue.
• These tables showed that . the 46,265 vehicles in service were owned by 6,230 separate proprietors, the great majority being owners of fleets not exceeding 24 vehicles. We pointed out that, as compared with the statistics for 1931, these figures indicated 256 fewer operators and 211 fewer vehicles, the reductions being chiefly among the small owners.
This reduction in the number of public-service-vehicle operators owning small fleets is a process
which continues, and doubtless will continue for some time to come. It is, however, a matter of which it is easy to exaggerate the importance-from whichever point of view one looks at it.
News of mergers and absorptions, and rumours of such, reach us almost every day (especially rumours), but there is still a large number of small independent
proprietors, and, in the vast majority of cases, there is no reason why they should sell out to the larger operators unless it is in their interest to do so.
The Road Traffic Act is not free from faults. The motive behind it and the method of working its licensing procedure has undoubtedly hampered development, but it has at least provided for the small operator a degree of security that he did not previously enjoy. It has eliminated the uneconomic competition that was rife in 1930 and prior to that date, by stabilizing fares and
preventing certain other unfair practices that were, in some cases, indulged in by large and small operators alike. The travelling public has benefited by the provision of regular coach and bus services on which it may rely and, generally, on a higher standard of comfort and safety in the vehicles themselves.
The question is : Will the operator be able to expand? The answer may be in the lap of the gods, but is probably in the hands of the apostles of "stabilization." Meanwhile, this much is certain-the public appetite for road transport is growing ; we must strive to satisfy it.